Human-Machine Interface for an Electric Truck
01Overview
Background
The HMI Capstone sponsored by PACCAR was created to design a human-machine interface (HMI) for the University of Washington's E-Truck, a student-led initiative to convert a Class 7 diesel truck into an electric vehicle (EV) in a 4 year timeline.
Design Question
How might we design a safe, intuitive, development-ready HMI that enhances the driving experience in electric commercial trucks and supports the industry's transition to battery-electric vehicles?
User-Centered Design Approach
Interviewed PACCAR drivers; benchmarked Kenworth and Peterbilt HMI requirements
Generated concept sketches, built UI flows, and designed Figma wireframes
Defined content criteria, product dimensions, and placement with E-Truck
Built a ProtoPie demo with keyboard-simulated controls + Figma designs
02Problem
The trucking industry's transition to EVs
The current E-Truck had no digital interface capable of communicating EV-specific information to drivers.
0%
of medium- and heavy-duty vehicles in California must be zero-emission by 2045.
California Governor's Office of Business and Economic Development
Pain Points
01
The current diesel gauge is not equipped to show EV-critical information
02
Drivers still trust familiar analog cues so the HMI must blend old and new design language
03
Currently no interactive interface to track performance & charging metrics
04
No E-Truck members have any UX or digital design / prototyping background
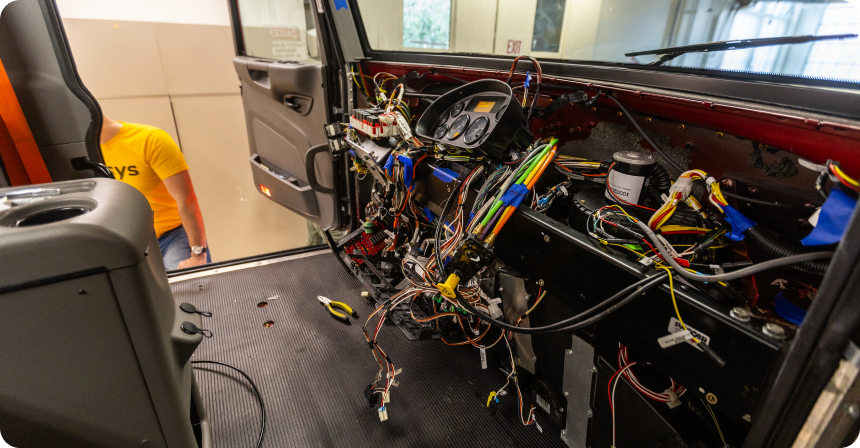
The E-Truck cab in its current state with the original diesel gauge cluster
03Solution
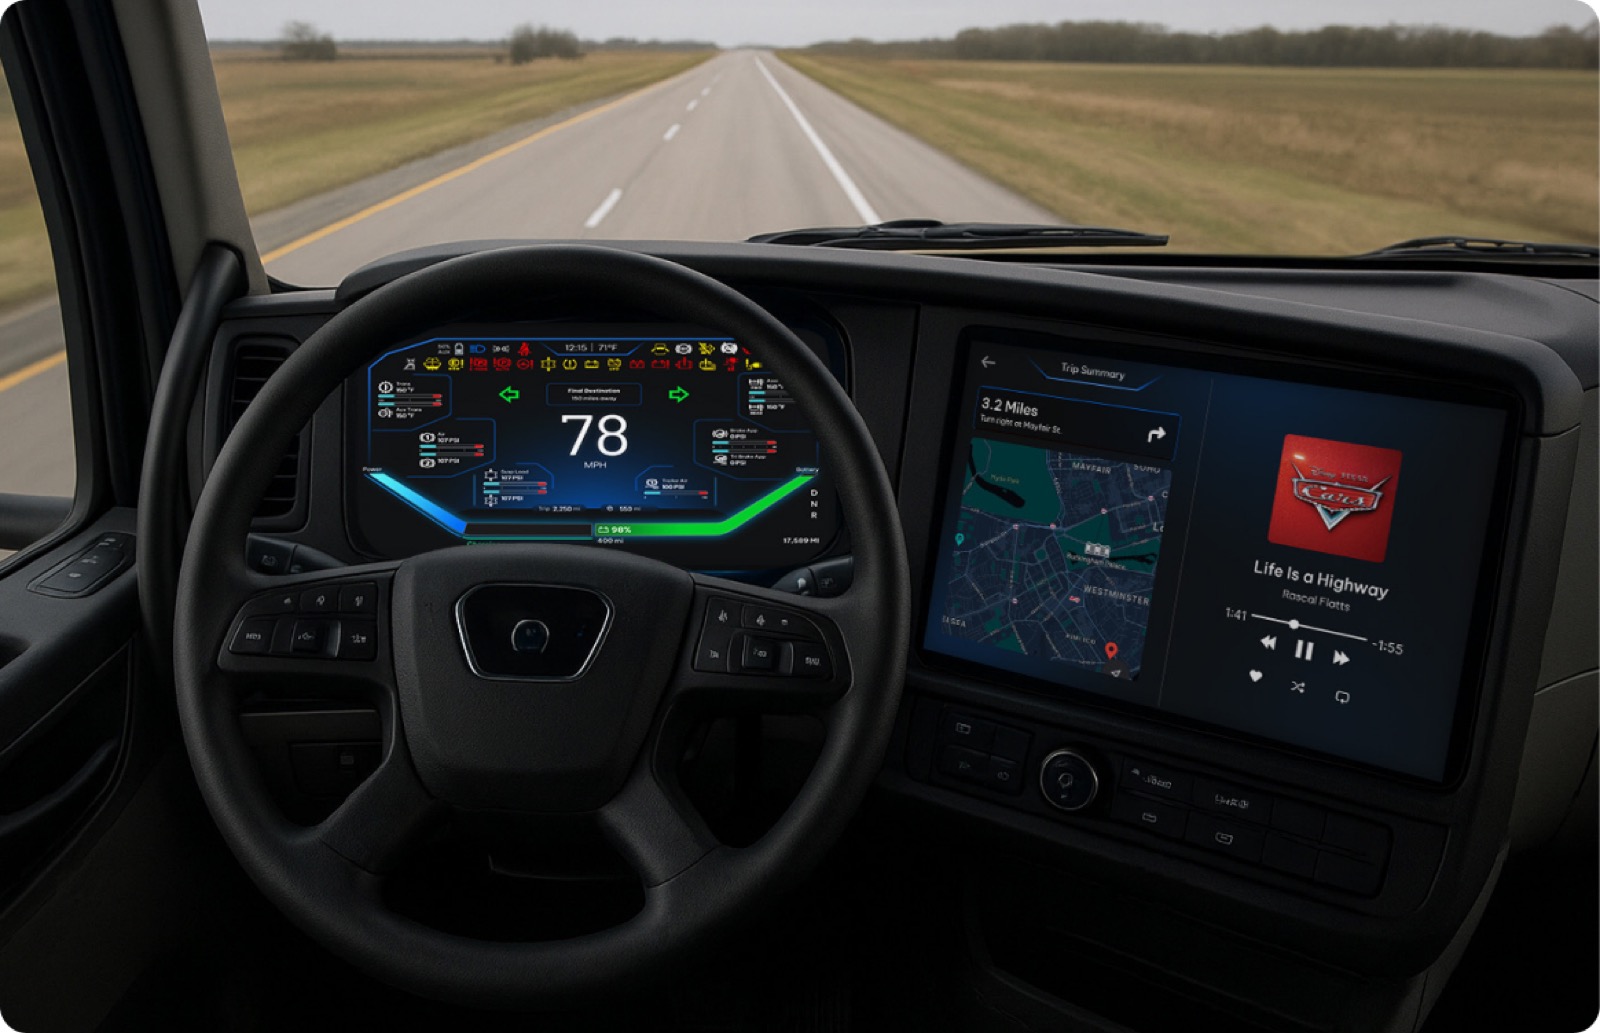
A dual-display HMI: A-Cluster & B-Cluster
We designed two co-existing displays - an A-Cluster driver instrument panel and a B-Cluster infotainment screen - that preserved diesel familiarity while surfacing EV-critical intelligence in real time.
 A-Cluster
 B-Cluster
A-Cluster driver instrument display (left) and B-Cluster infotainment display (right)
04Research
User interviews & competitive analysis
Our team interviewed PACCAR test-engineers, collaborated with E-Truck teams, and benchmarked Kenworth, Peterbilt, and competitor HMIs to define feature requirements.
5
Control team engineers interviewed
5
EV test engineers interviewed
5
Competitors benchmarked
Unlike conventional automotive vehicles, our trucks aren't just for transportation - they're a tool that drivers rely on every day to get their job done.
PACCAR Test Engineer
Competitive Analysis
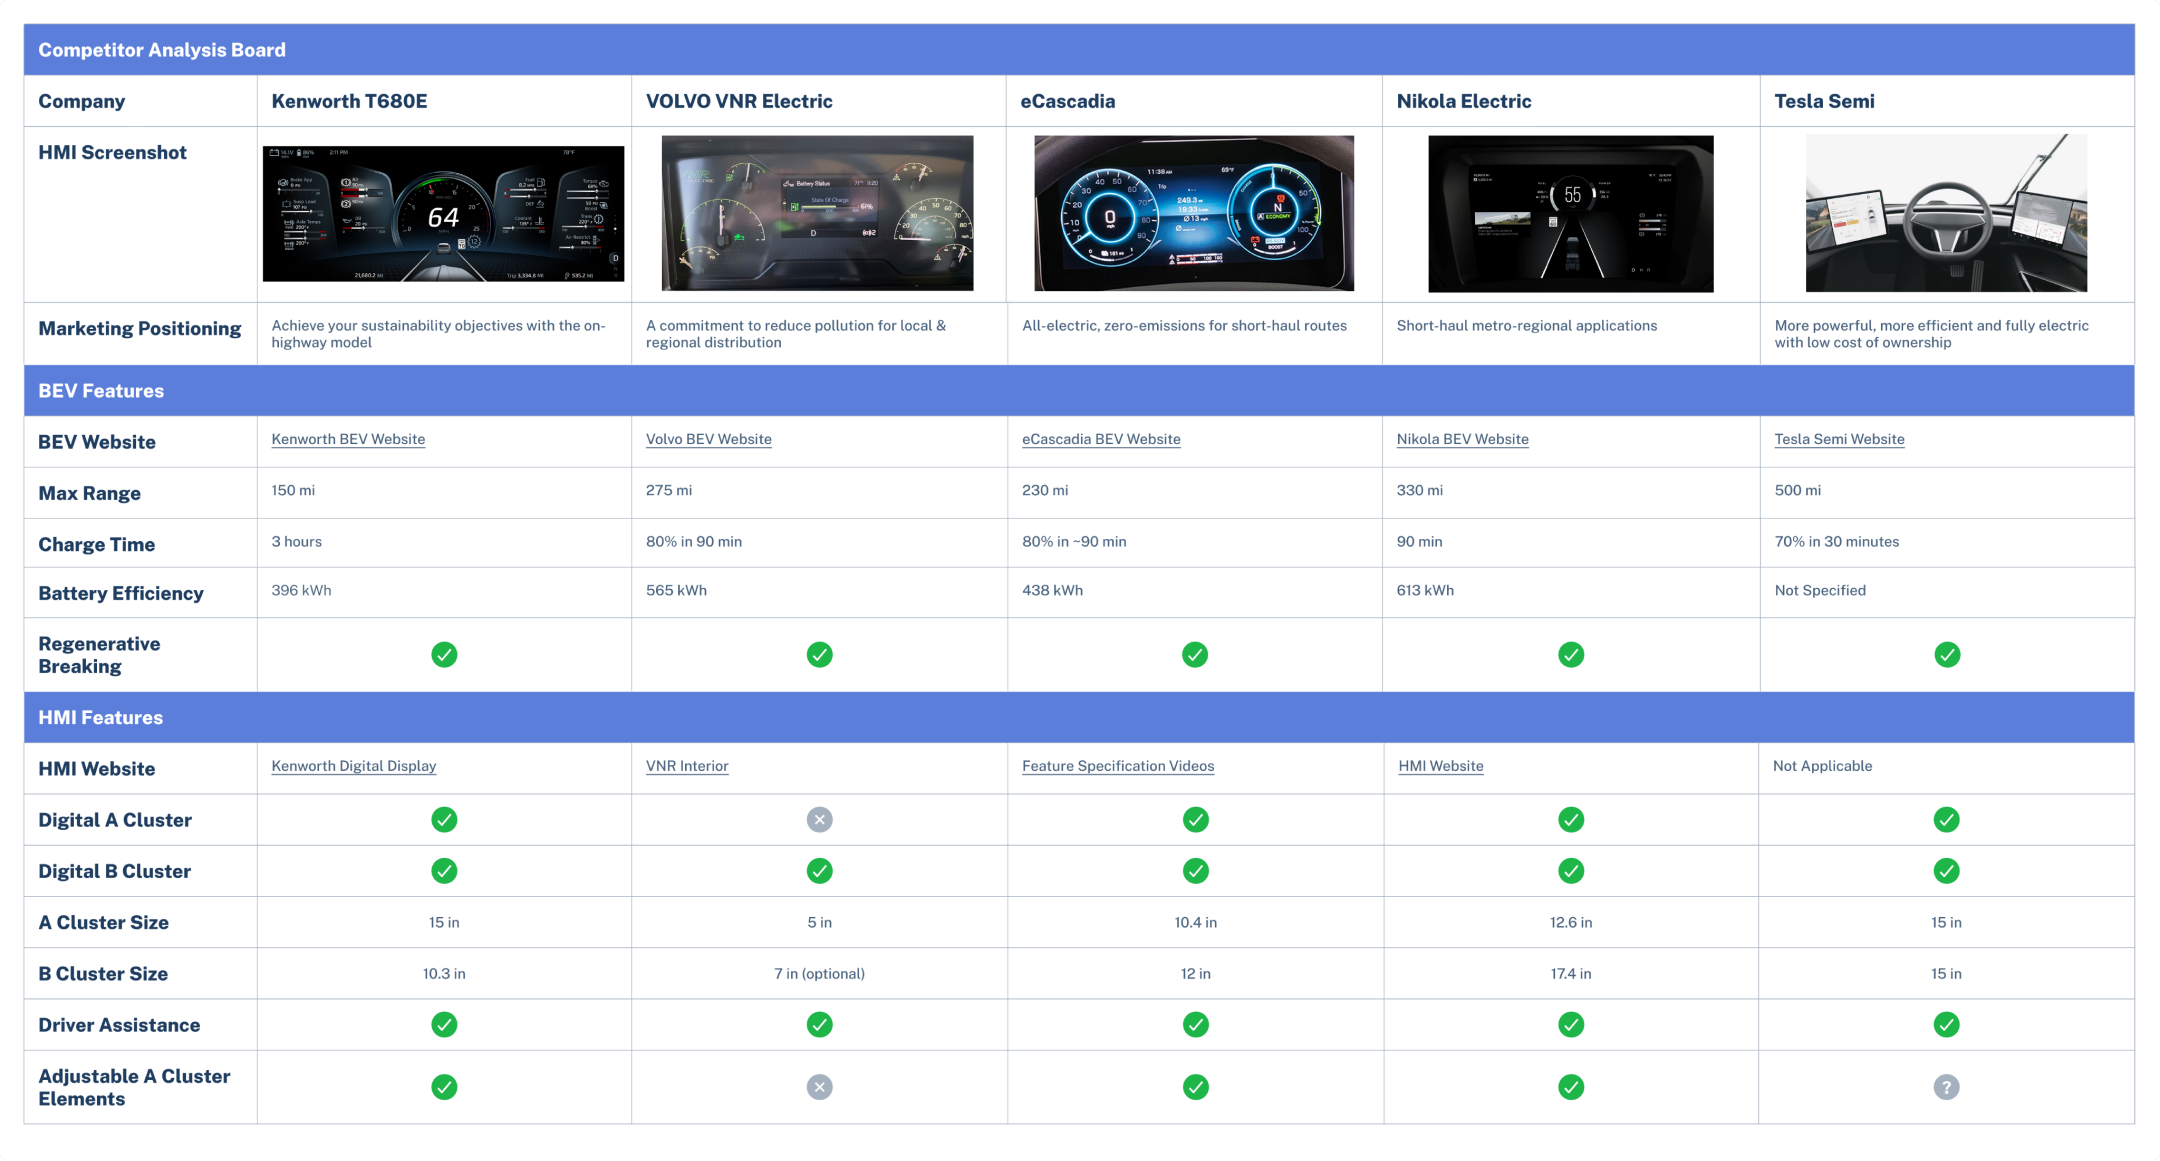
Kenworth T680E · VOLVO VNR Electric · eCascadia · Nikola Electric · Tesla Semi
Visual Design Exploration
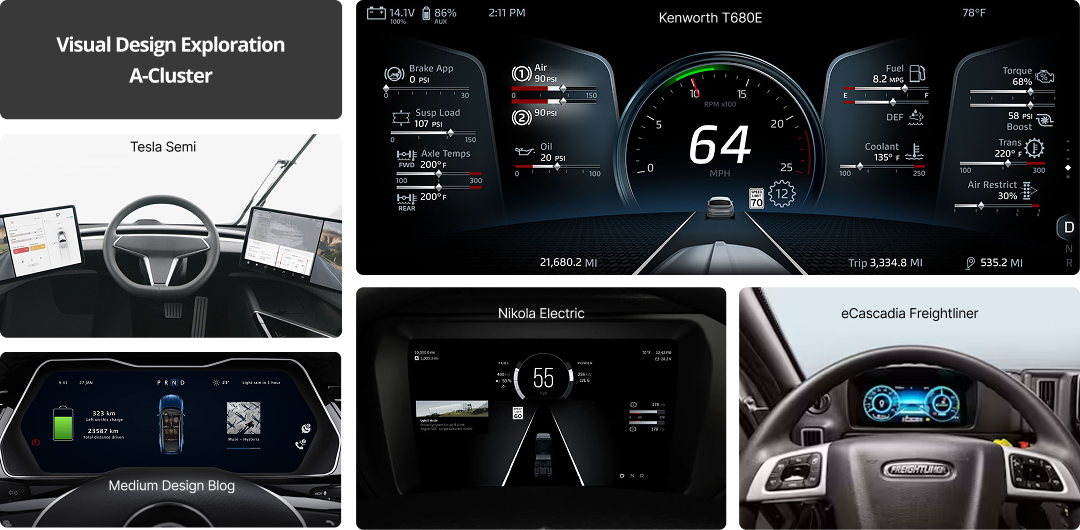
Reference HMIs from Tesla Semi, Kenworth T680E, Nikola Electric, and eCascadia Freightliner
Field Testing
Trips to the E-Truck shop helped us validate display shape for steering-wheel visibility and informed placement for gauges, the regenerative bar, and charge indicators.
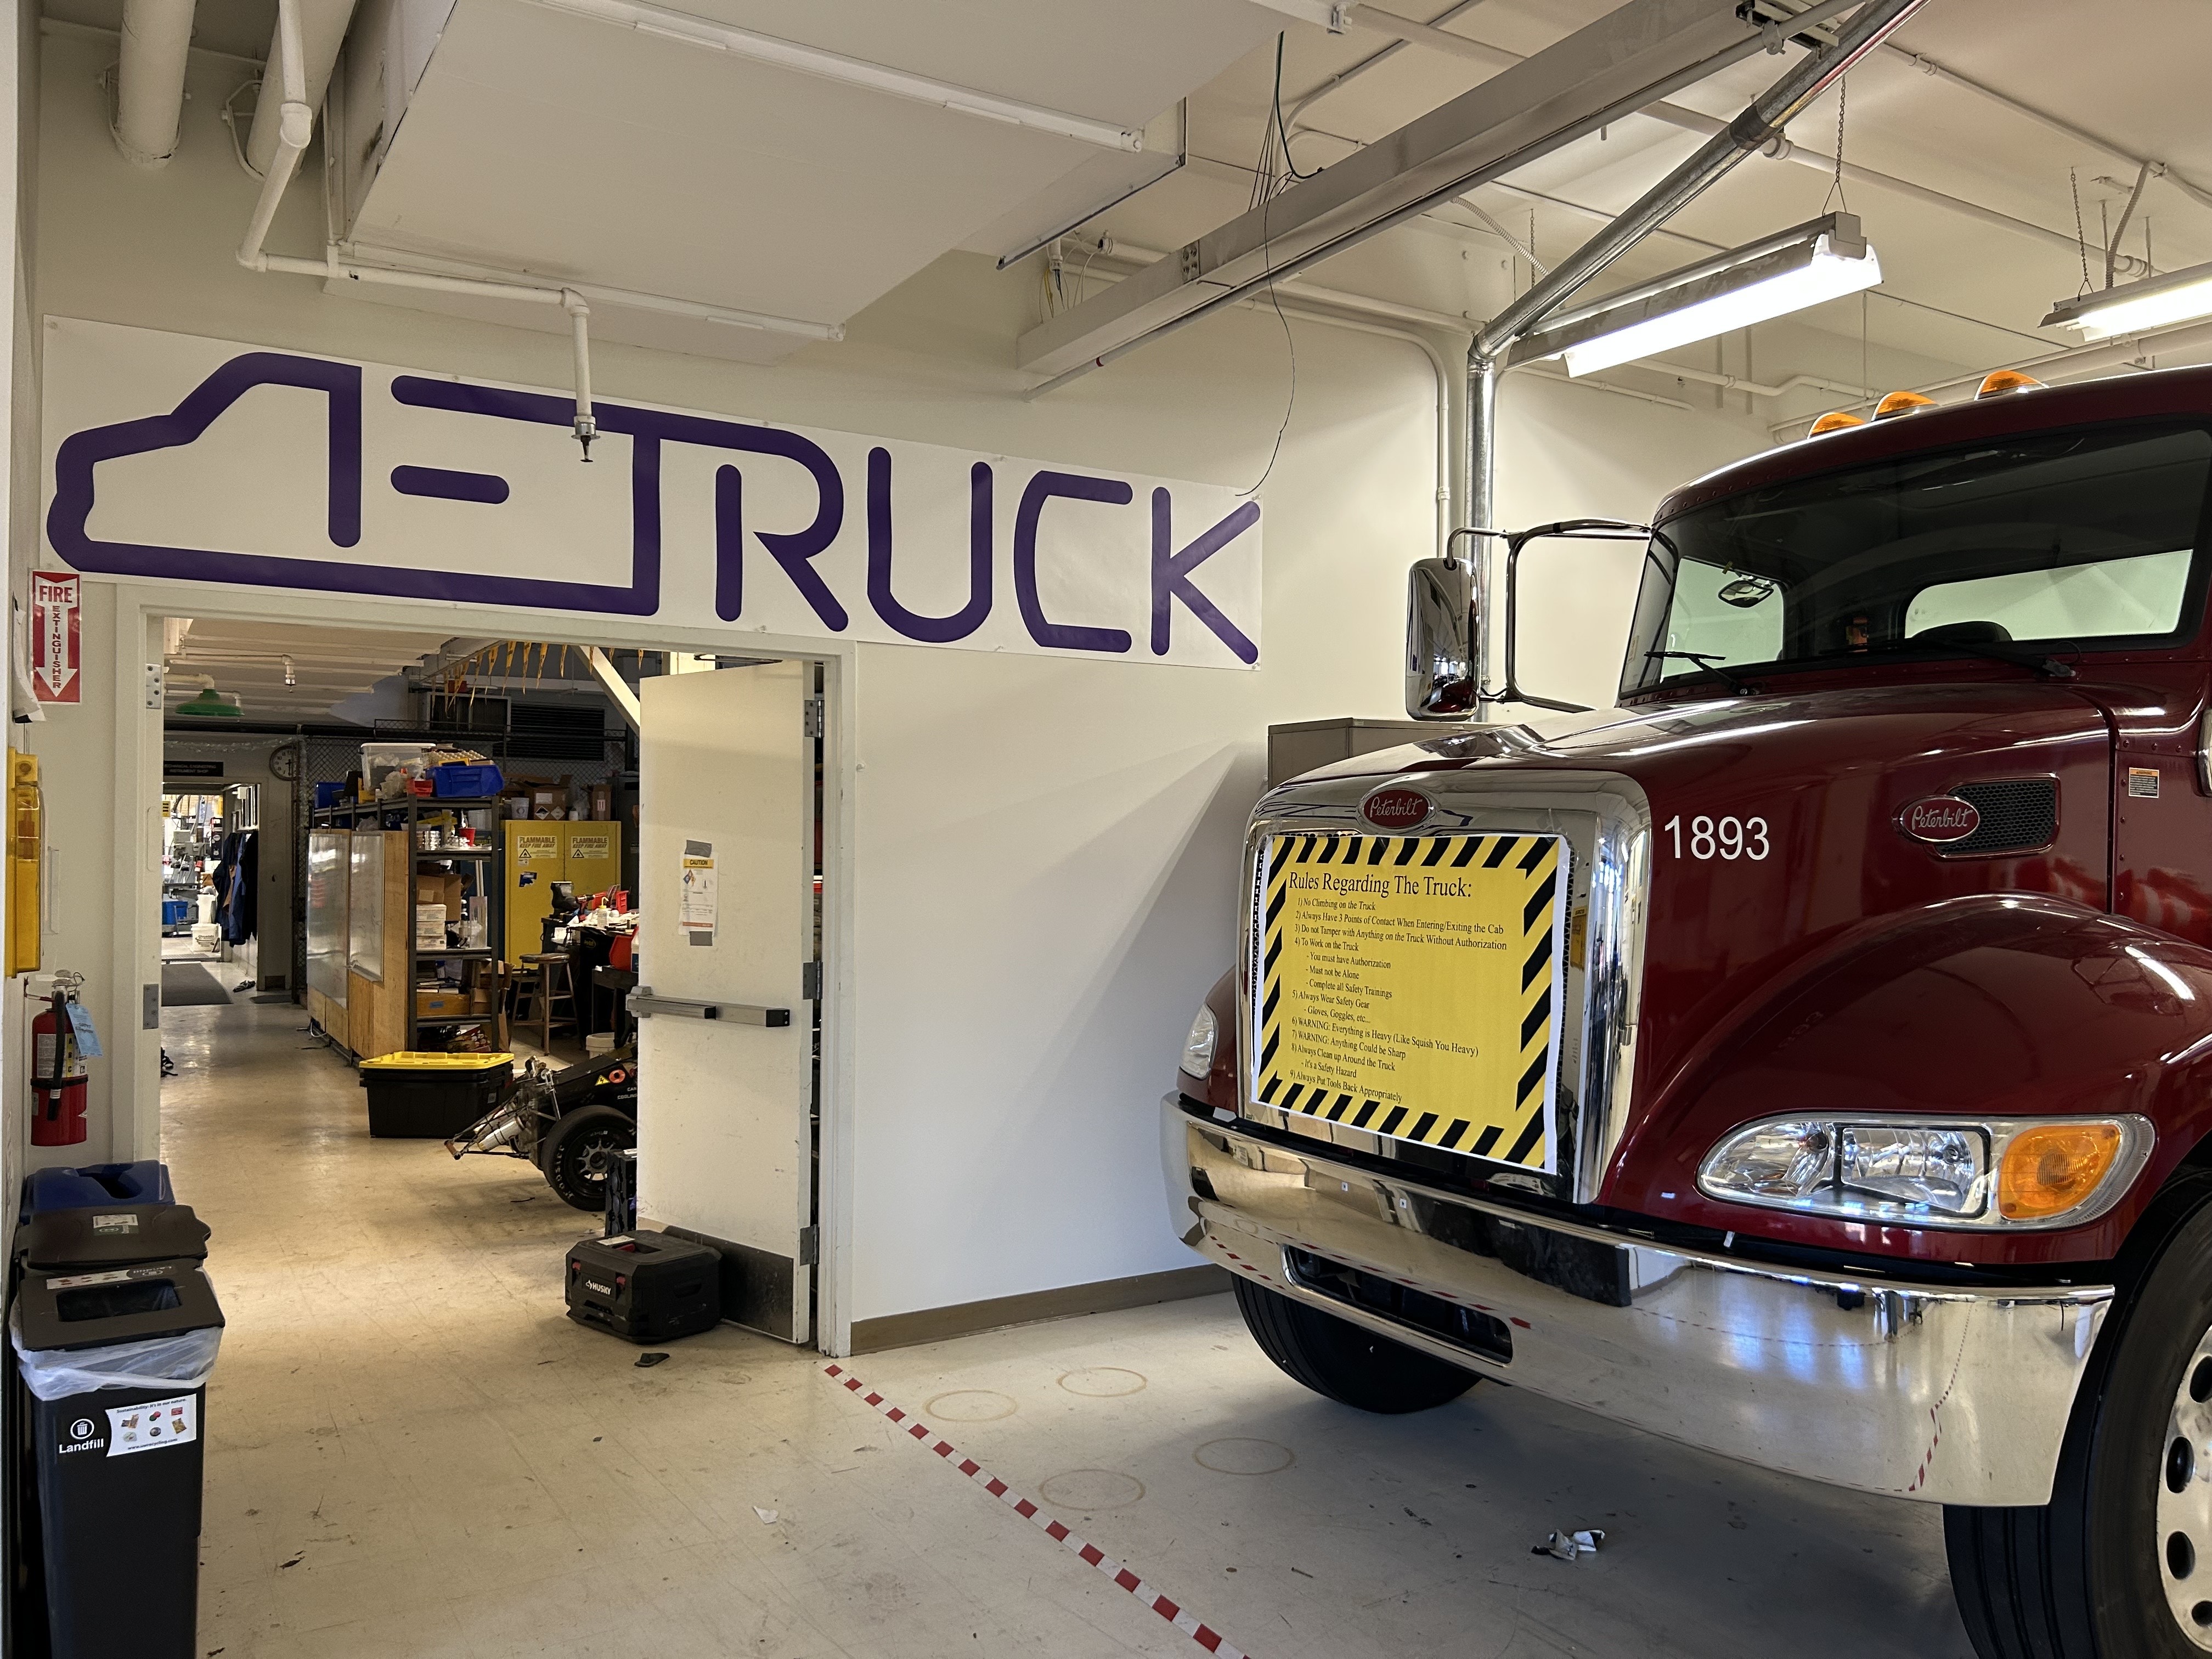 E-Truck Shop
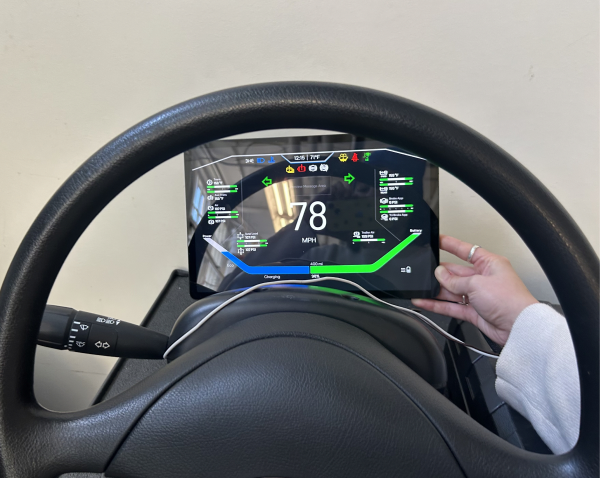 Cluster Sizing
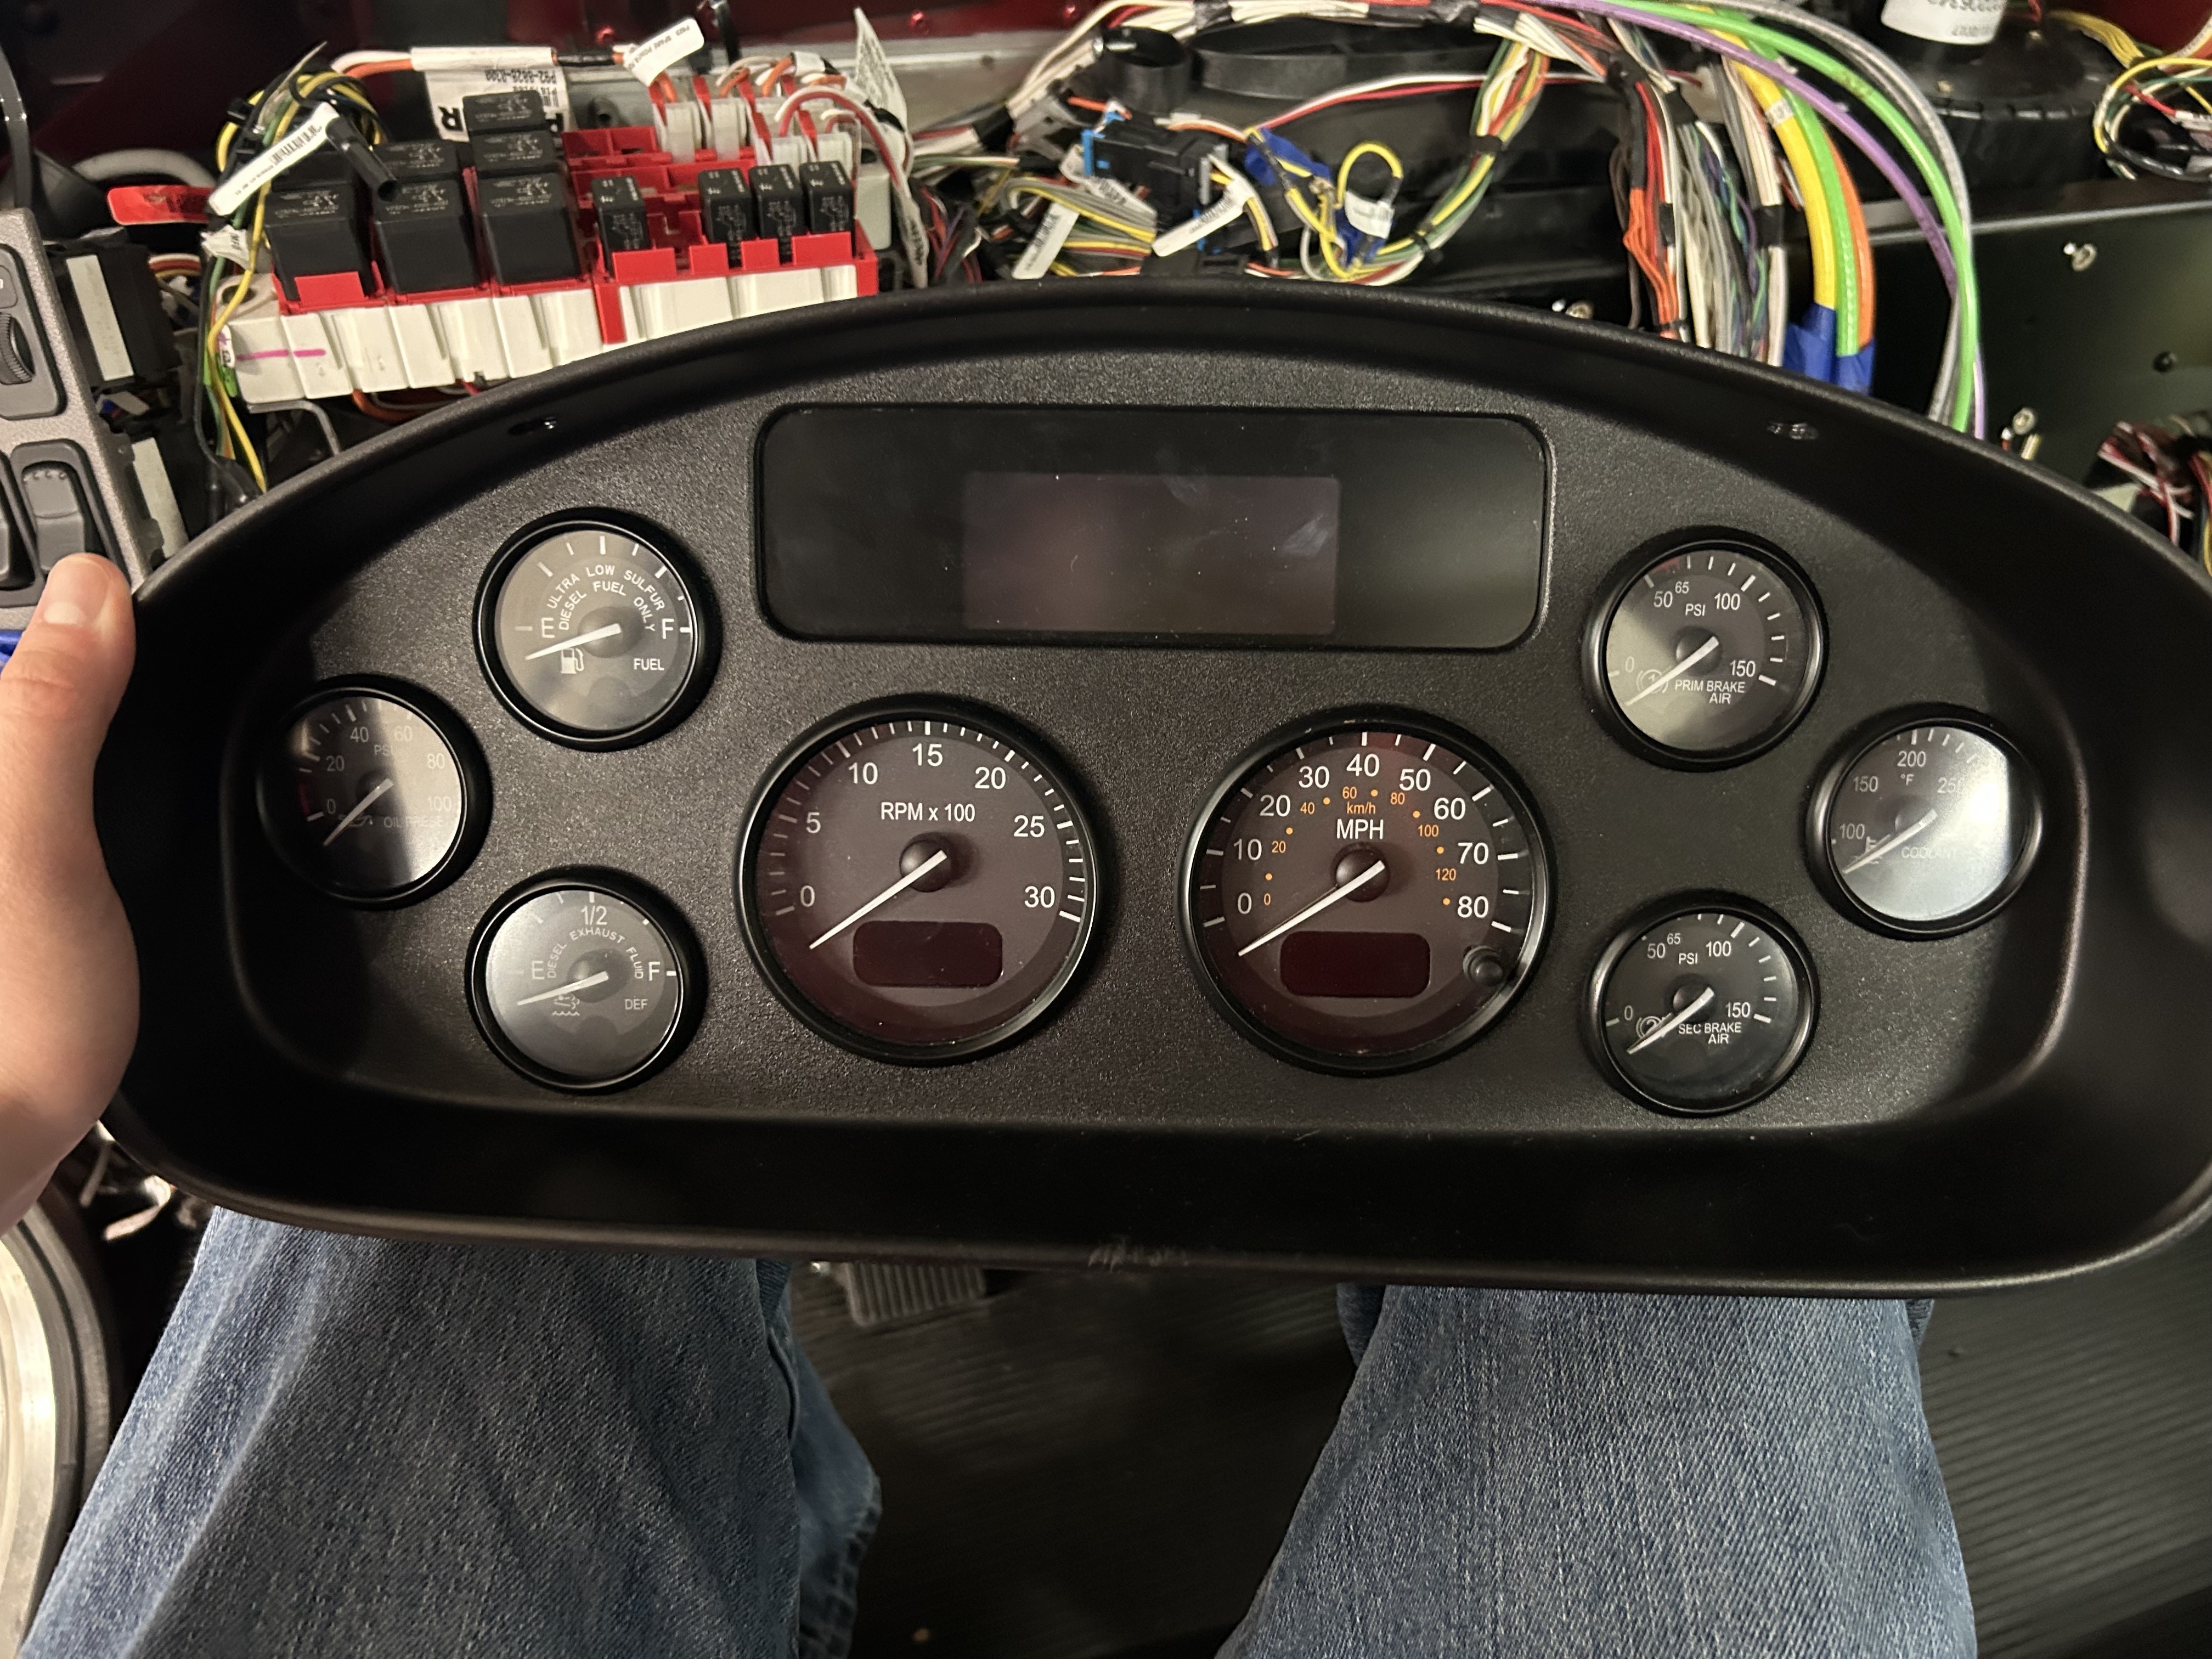 Diesel Cluster
Left: The E-Truck shop · Top right: Testing A-Cluster dimensions through the steering wheel · Bottom right: The original diesel gauge cluster
05Process
Building prototypes
Design Criteria
Translate EV Behavior
Reduce "range anxiety"
Communicate regenerative braking
Alert EV-specific warnings
Promote Safe Driving
Live system diagnostics
Prevent distractions
Keep analog familiarity
Real-Time Feedback
Display performance metrics
Highlight battery health
Optimize energy consumption
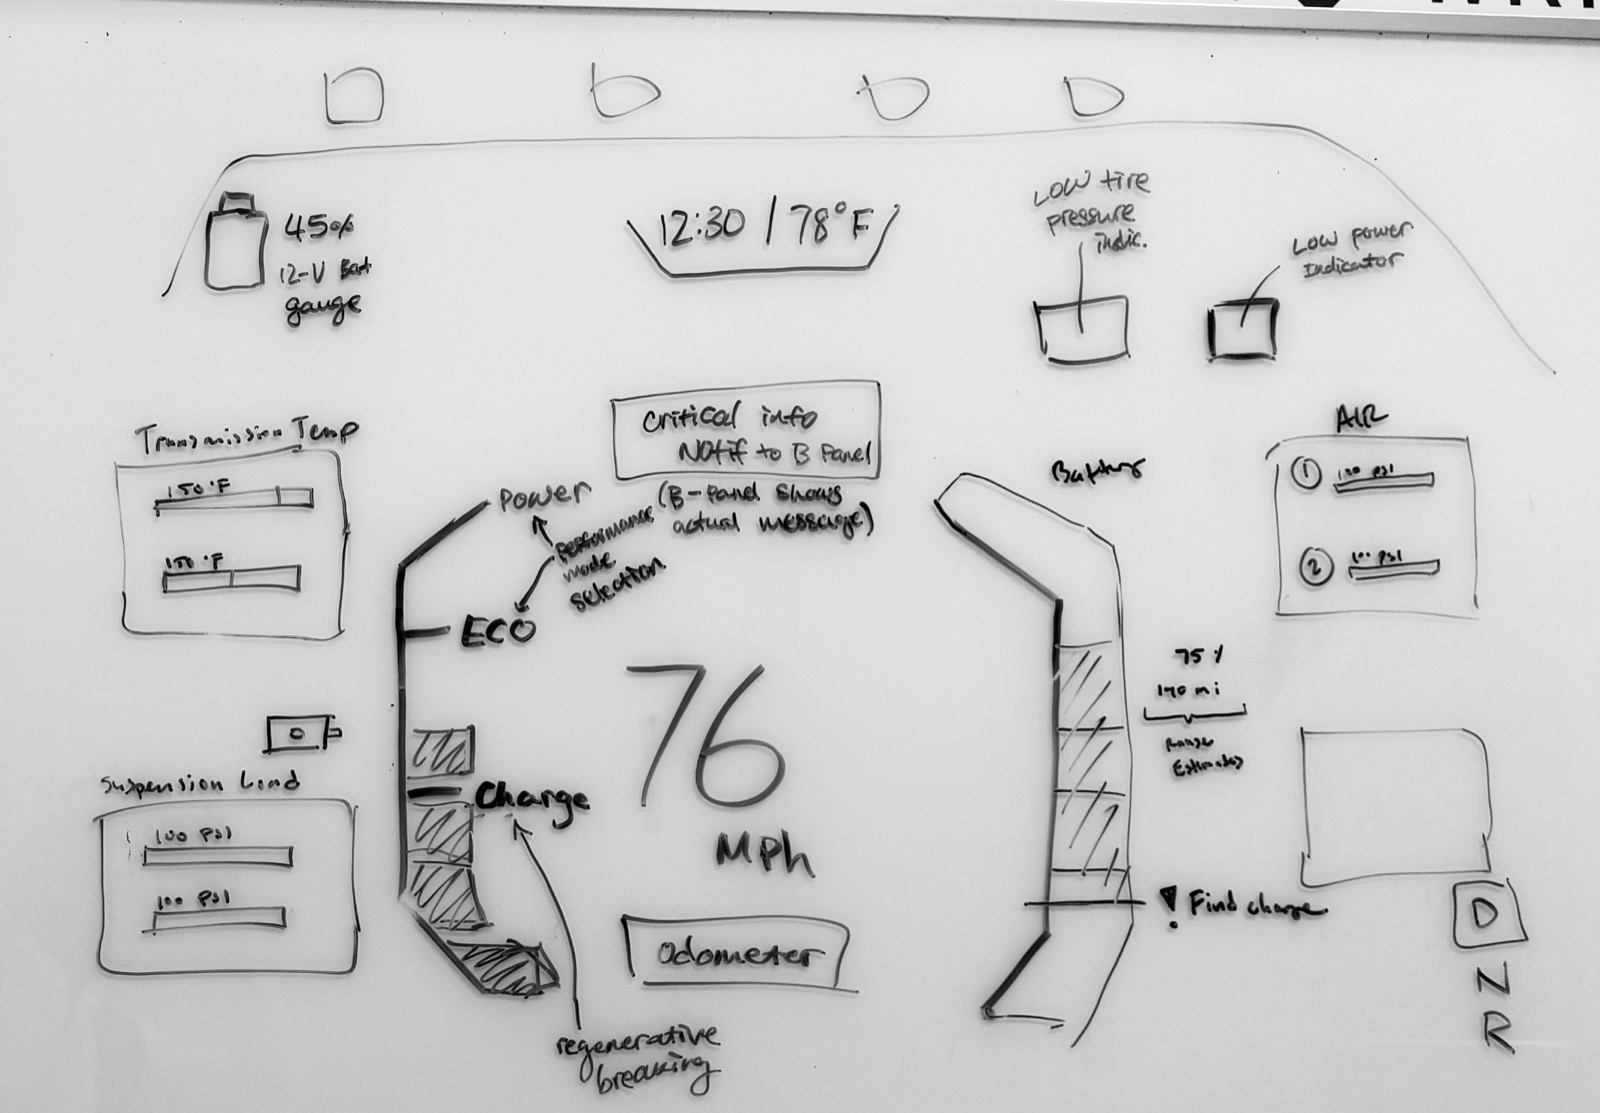
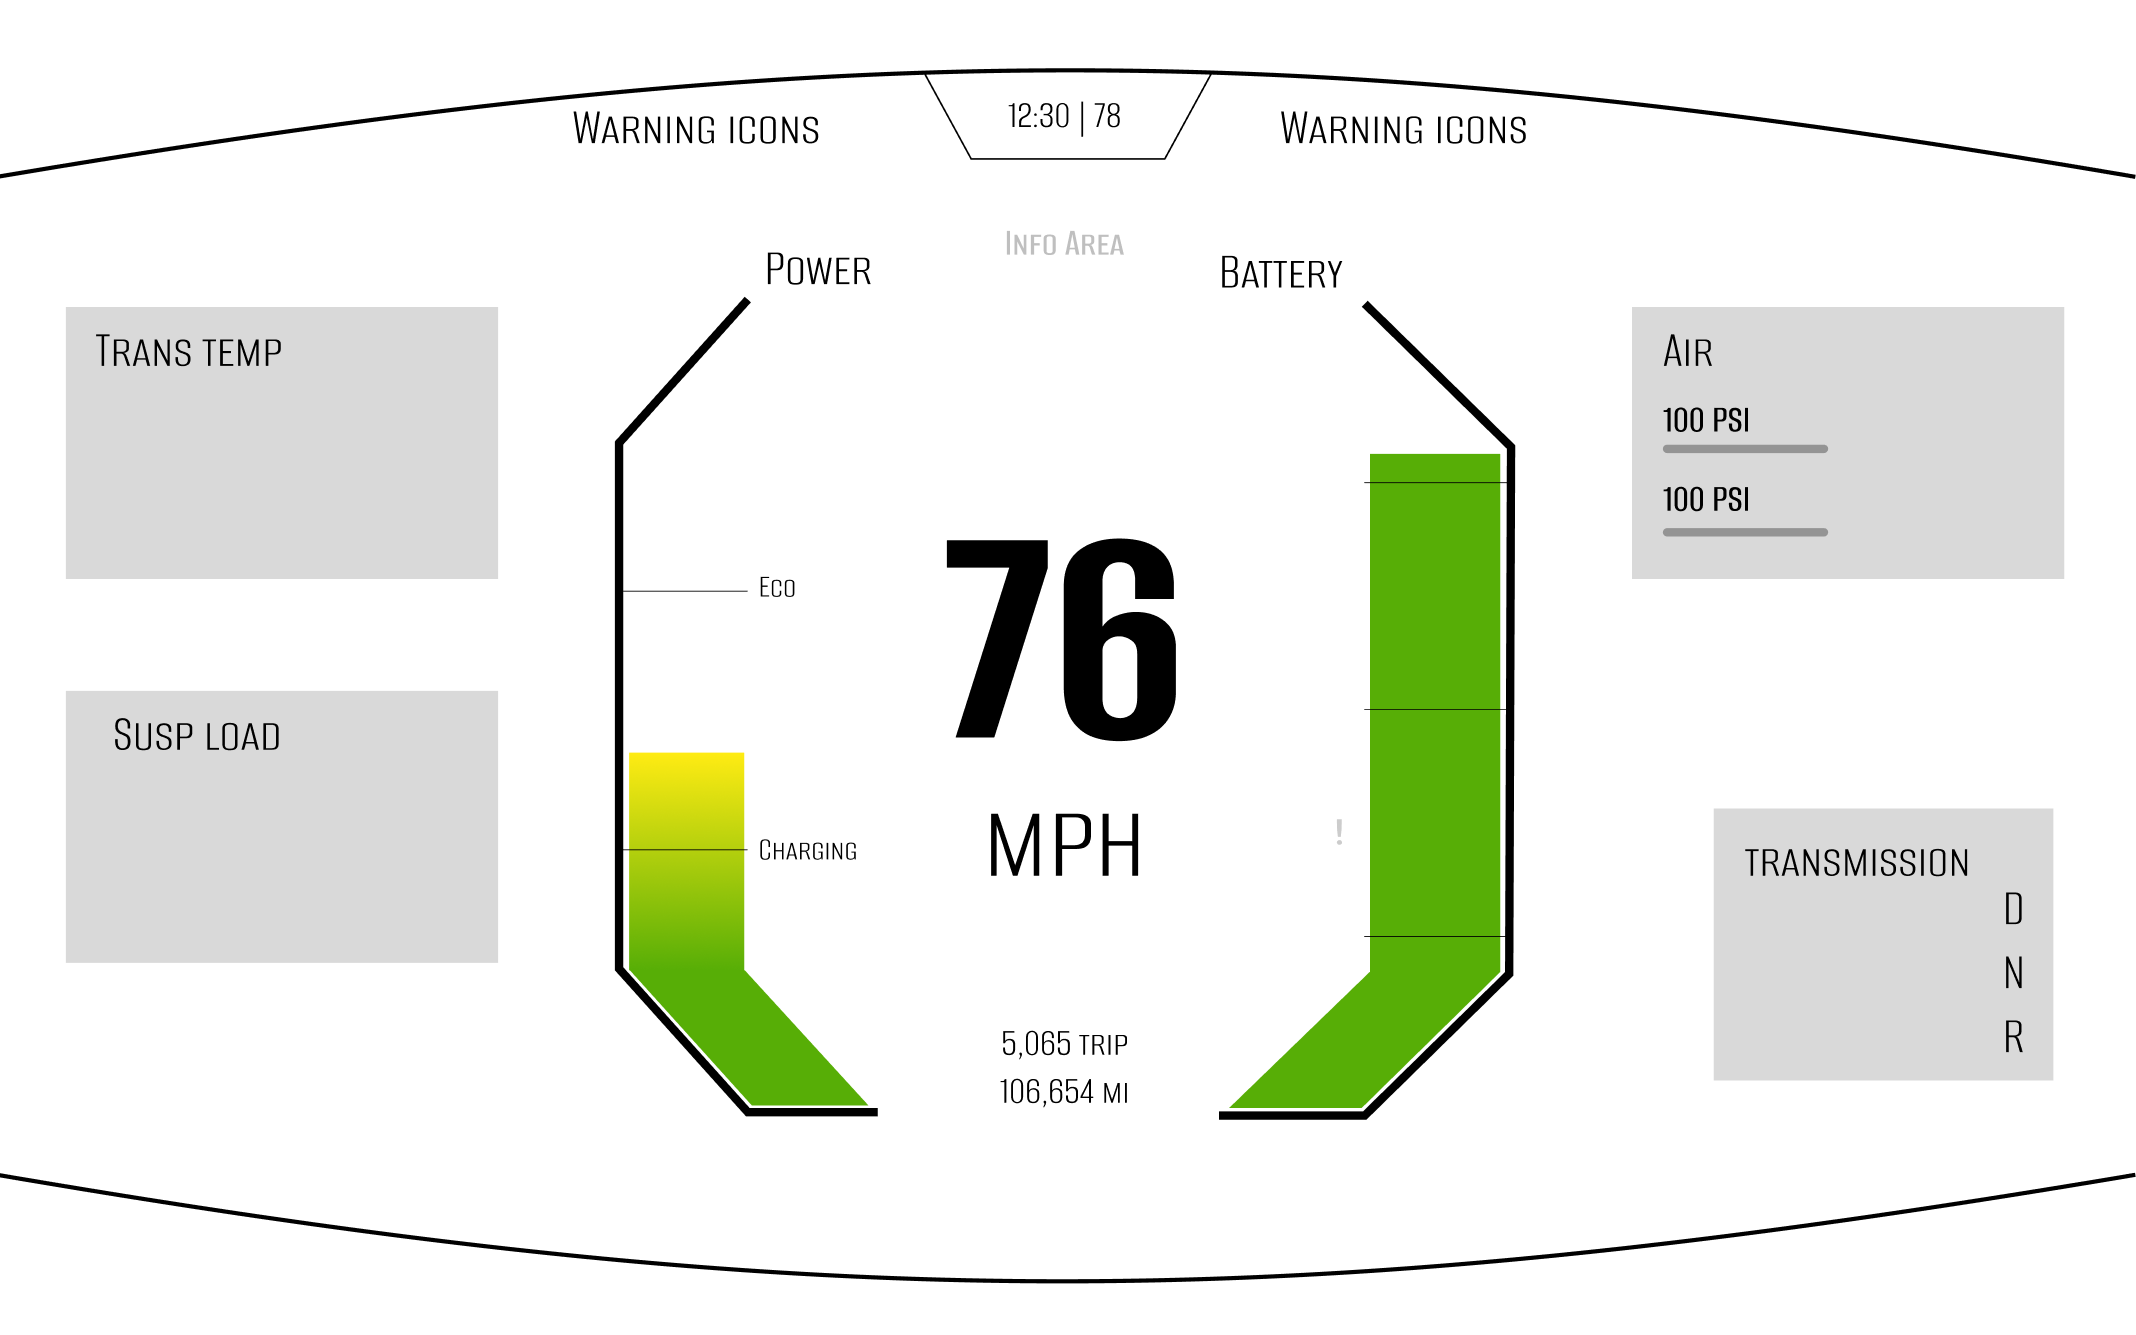
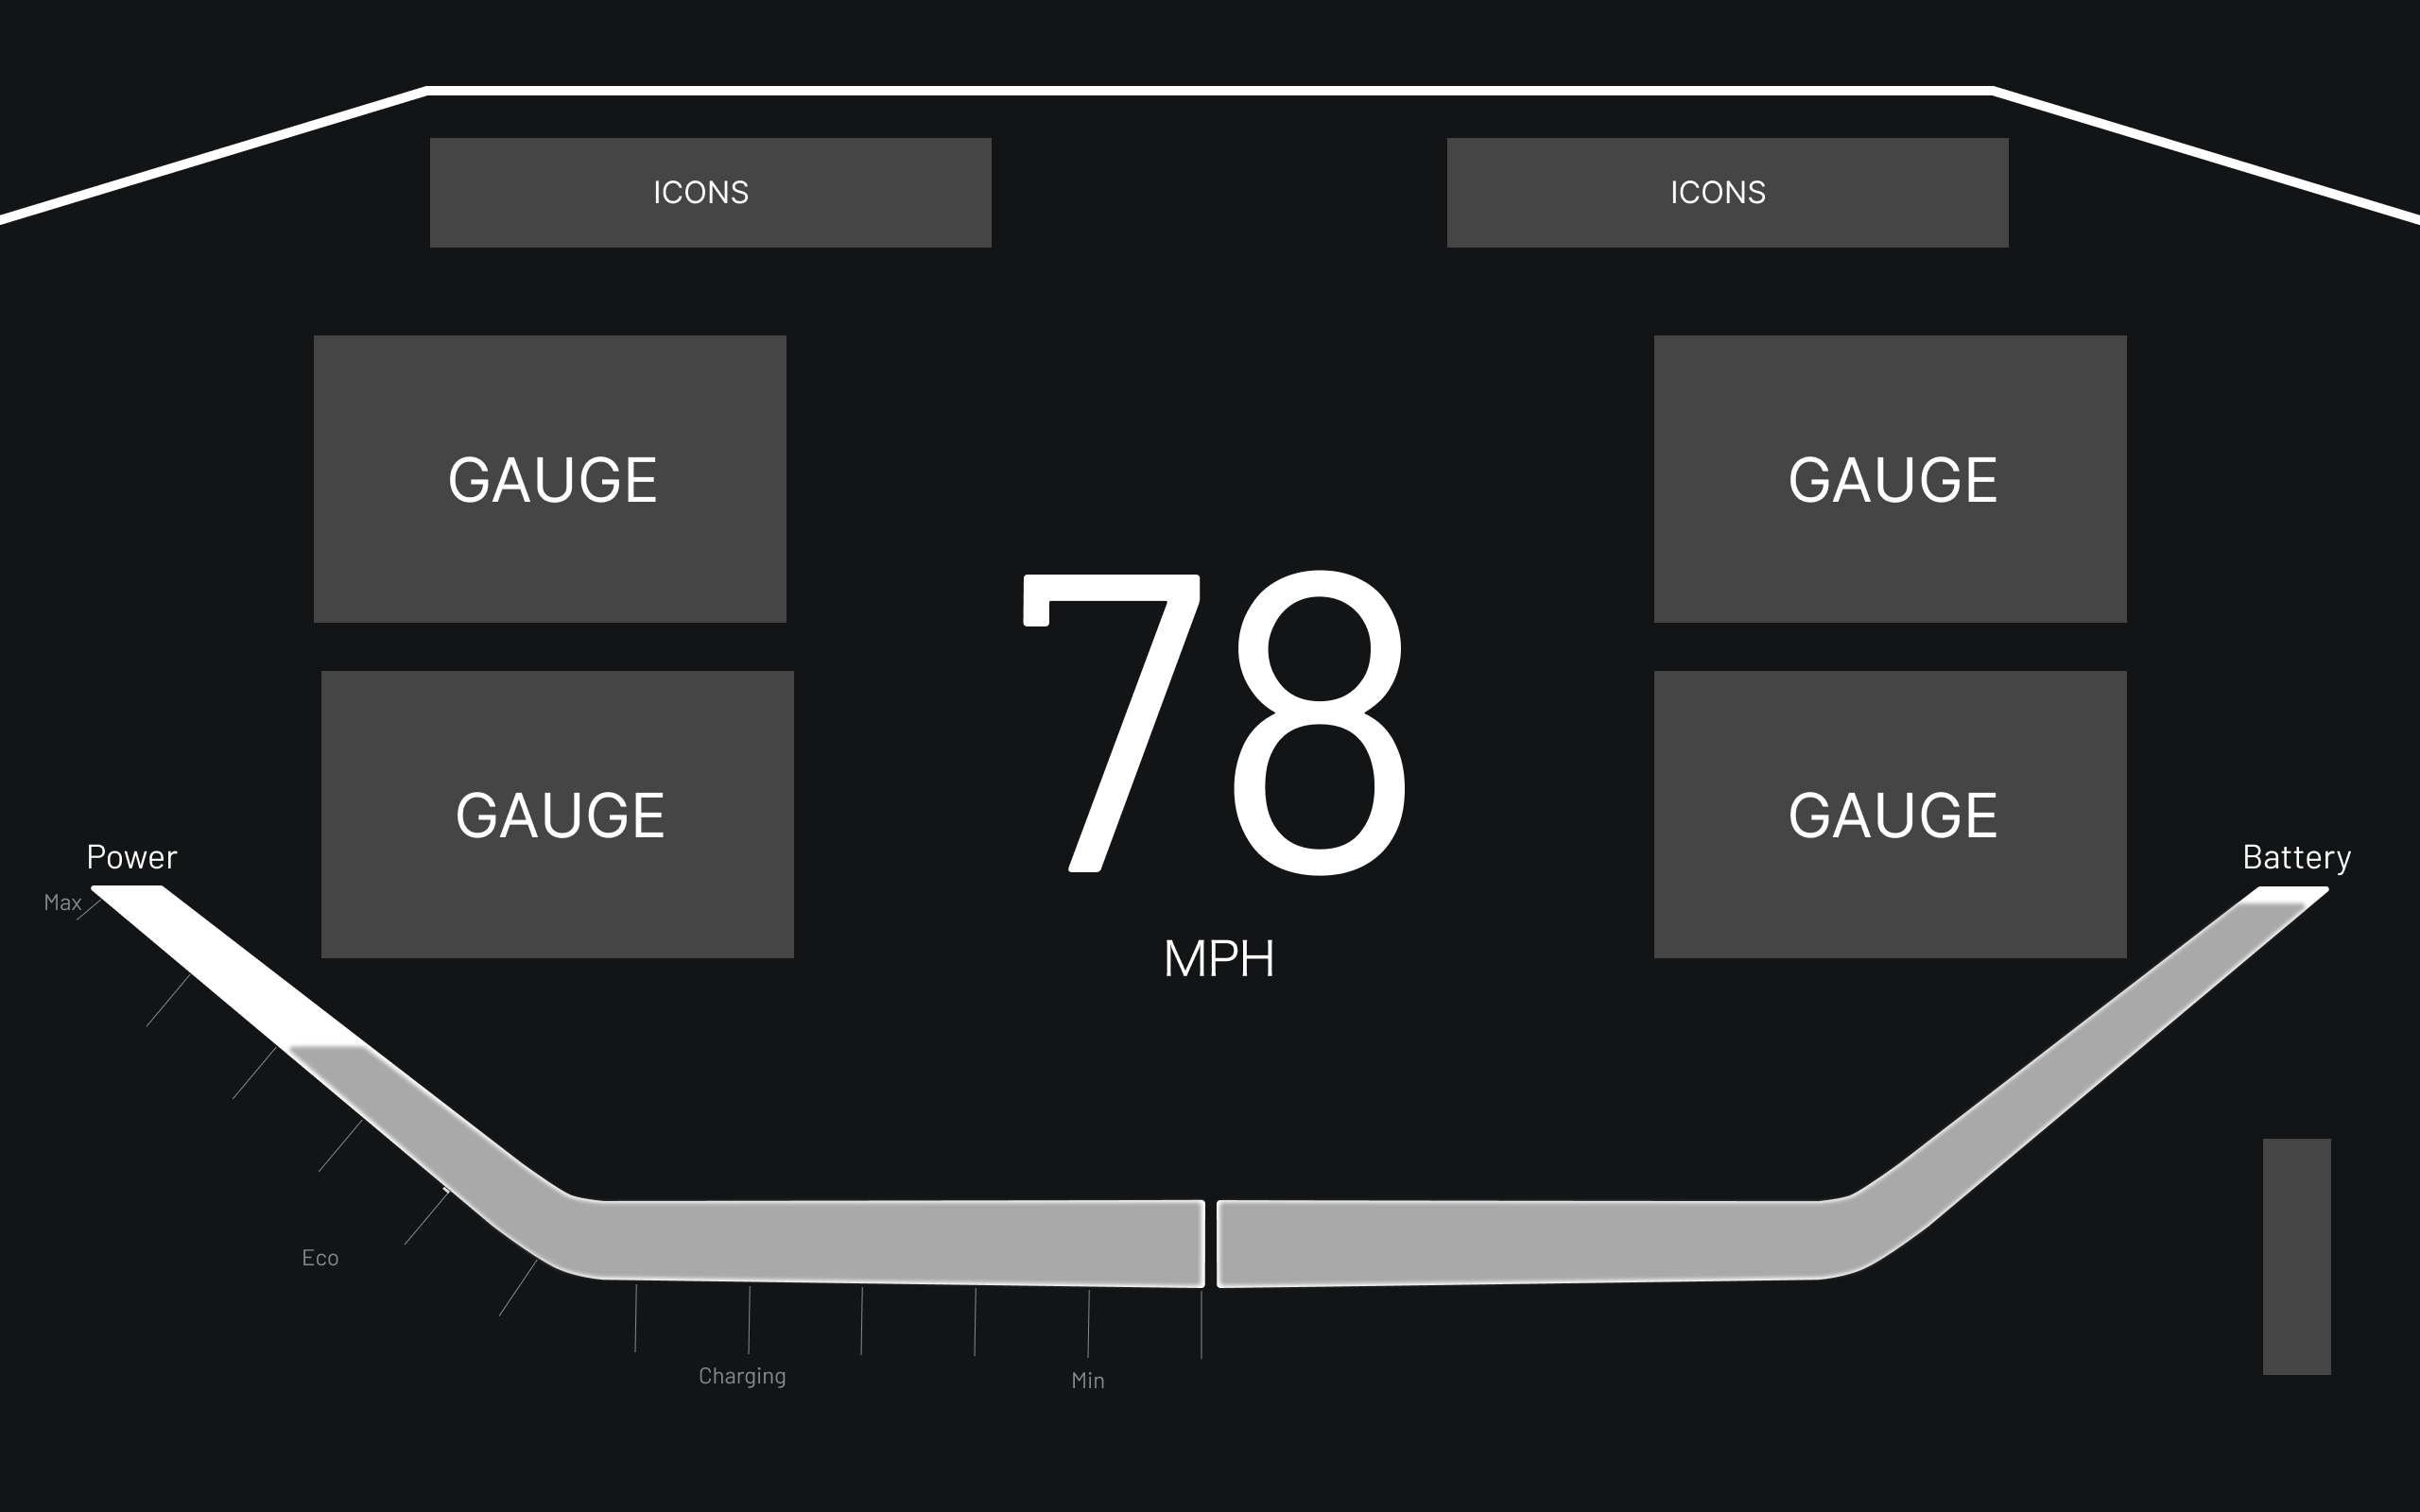
A-Cluster - Iterations
Interaction Architecture
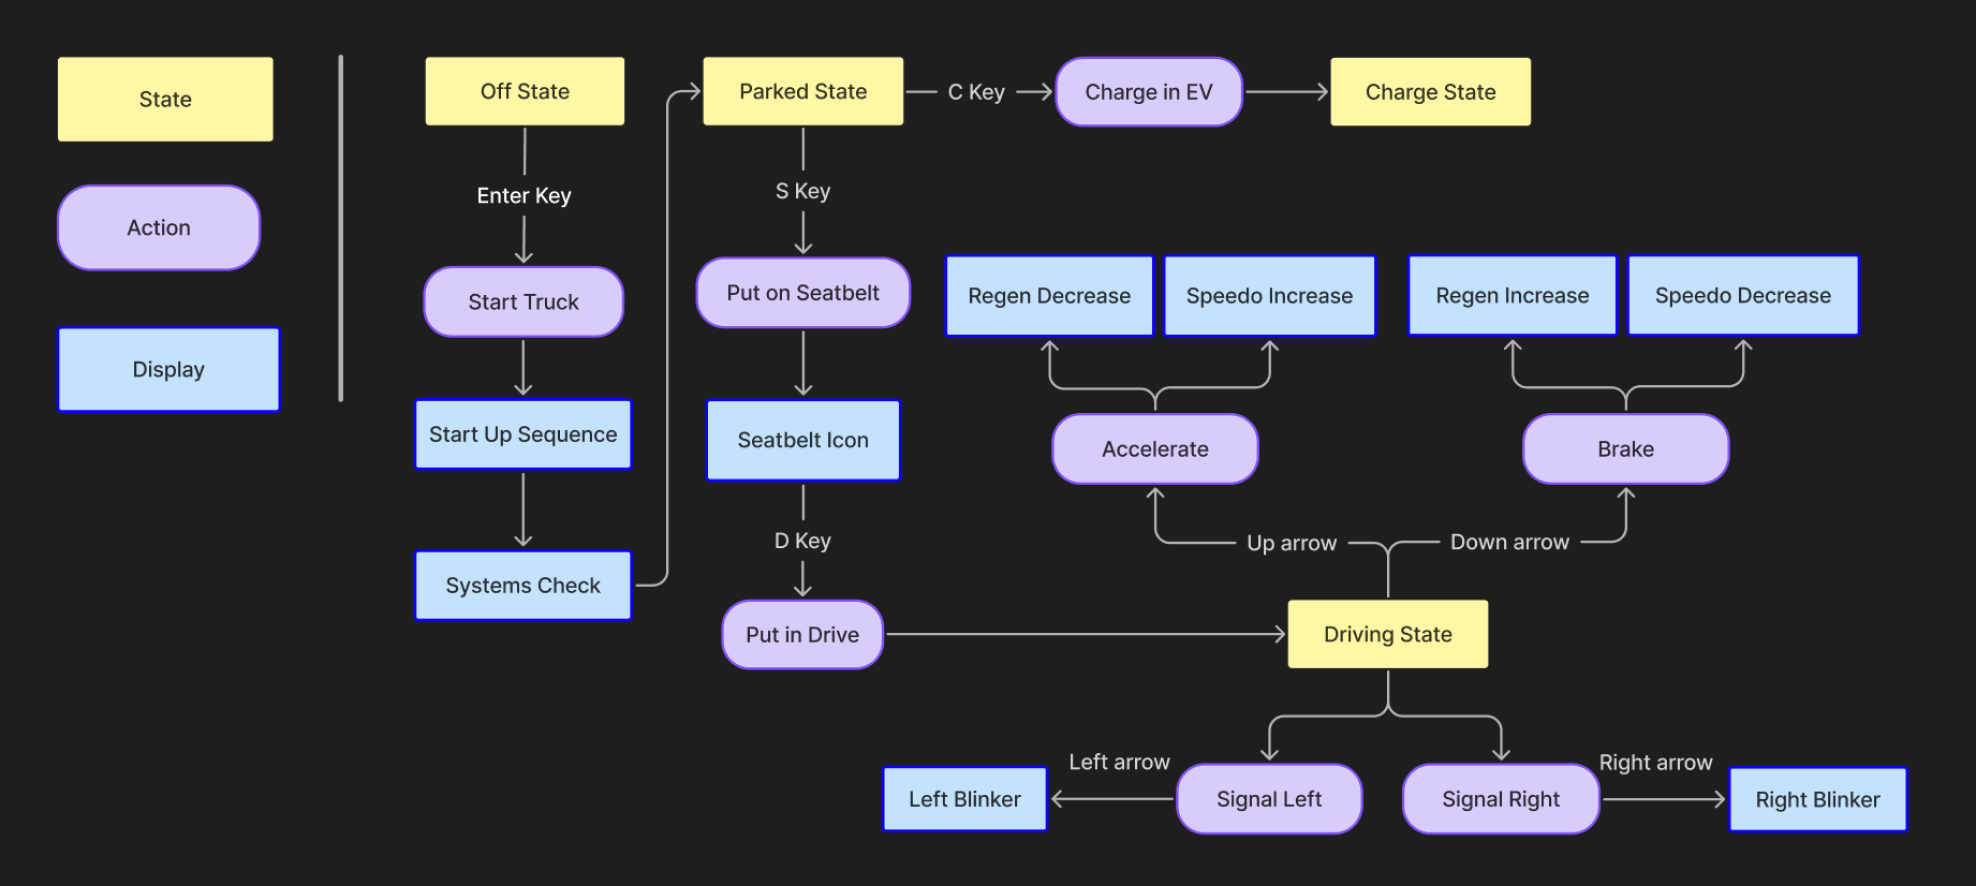
User flow mapping keyboard-driven transitions
06Final Product
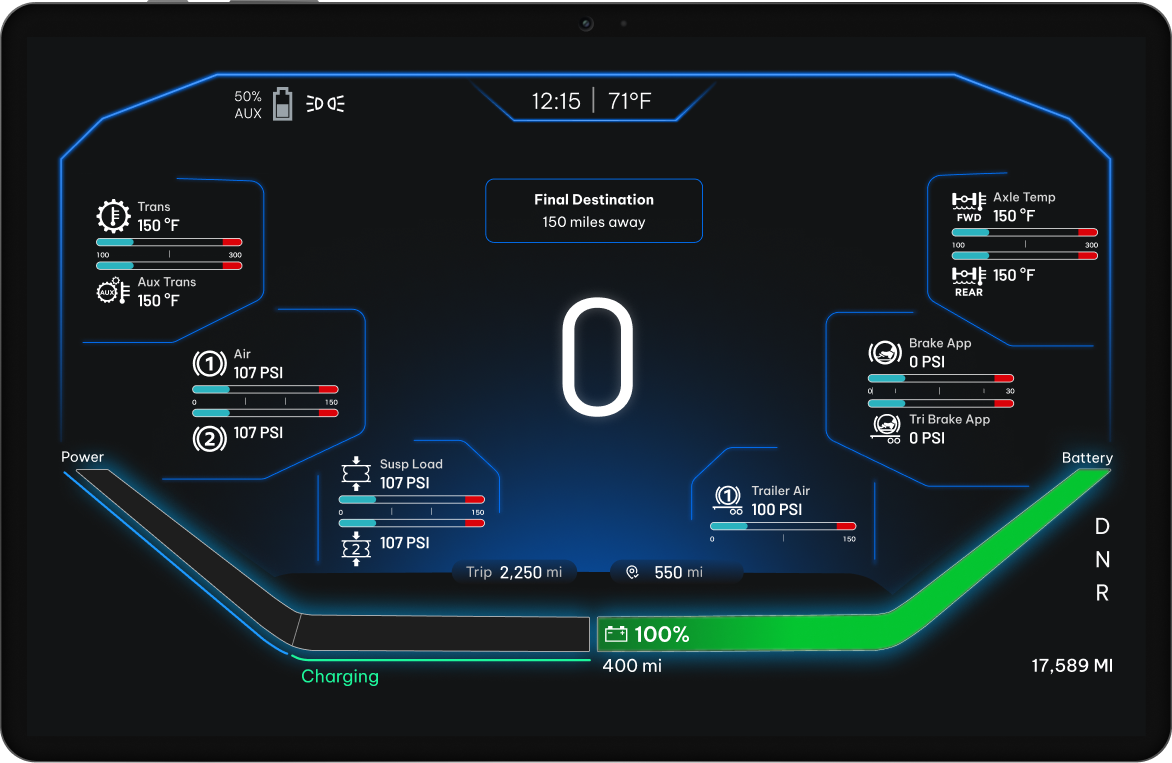
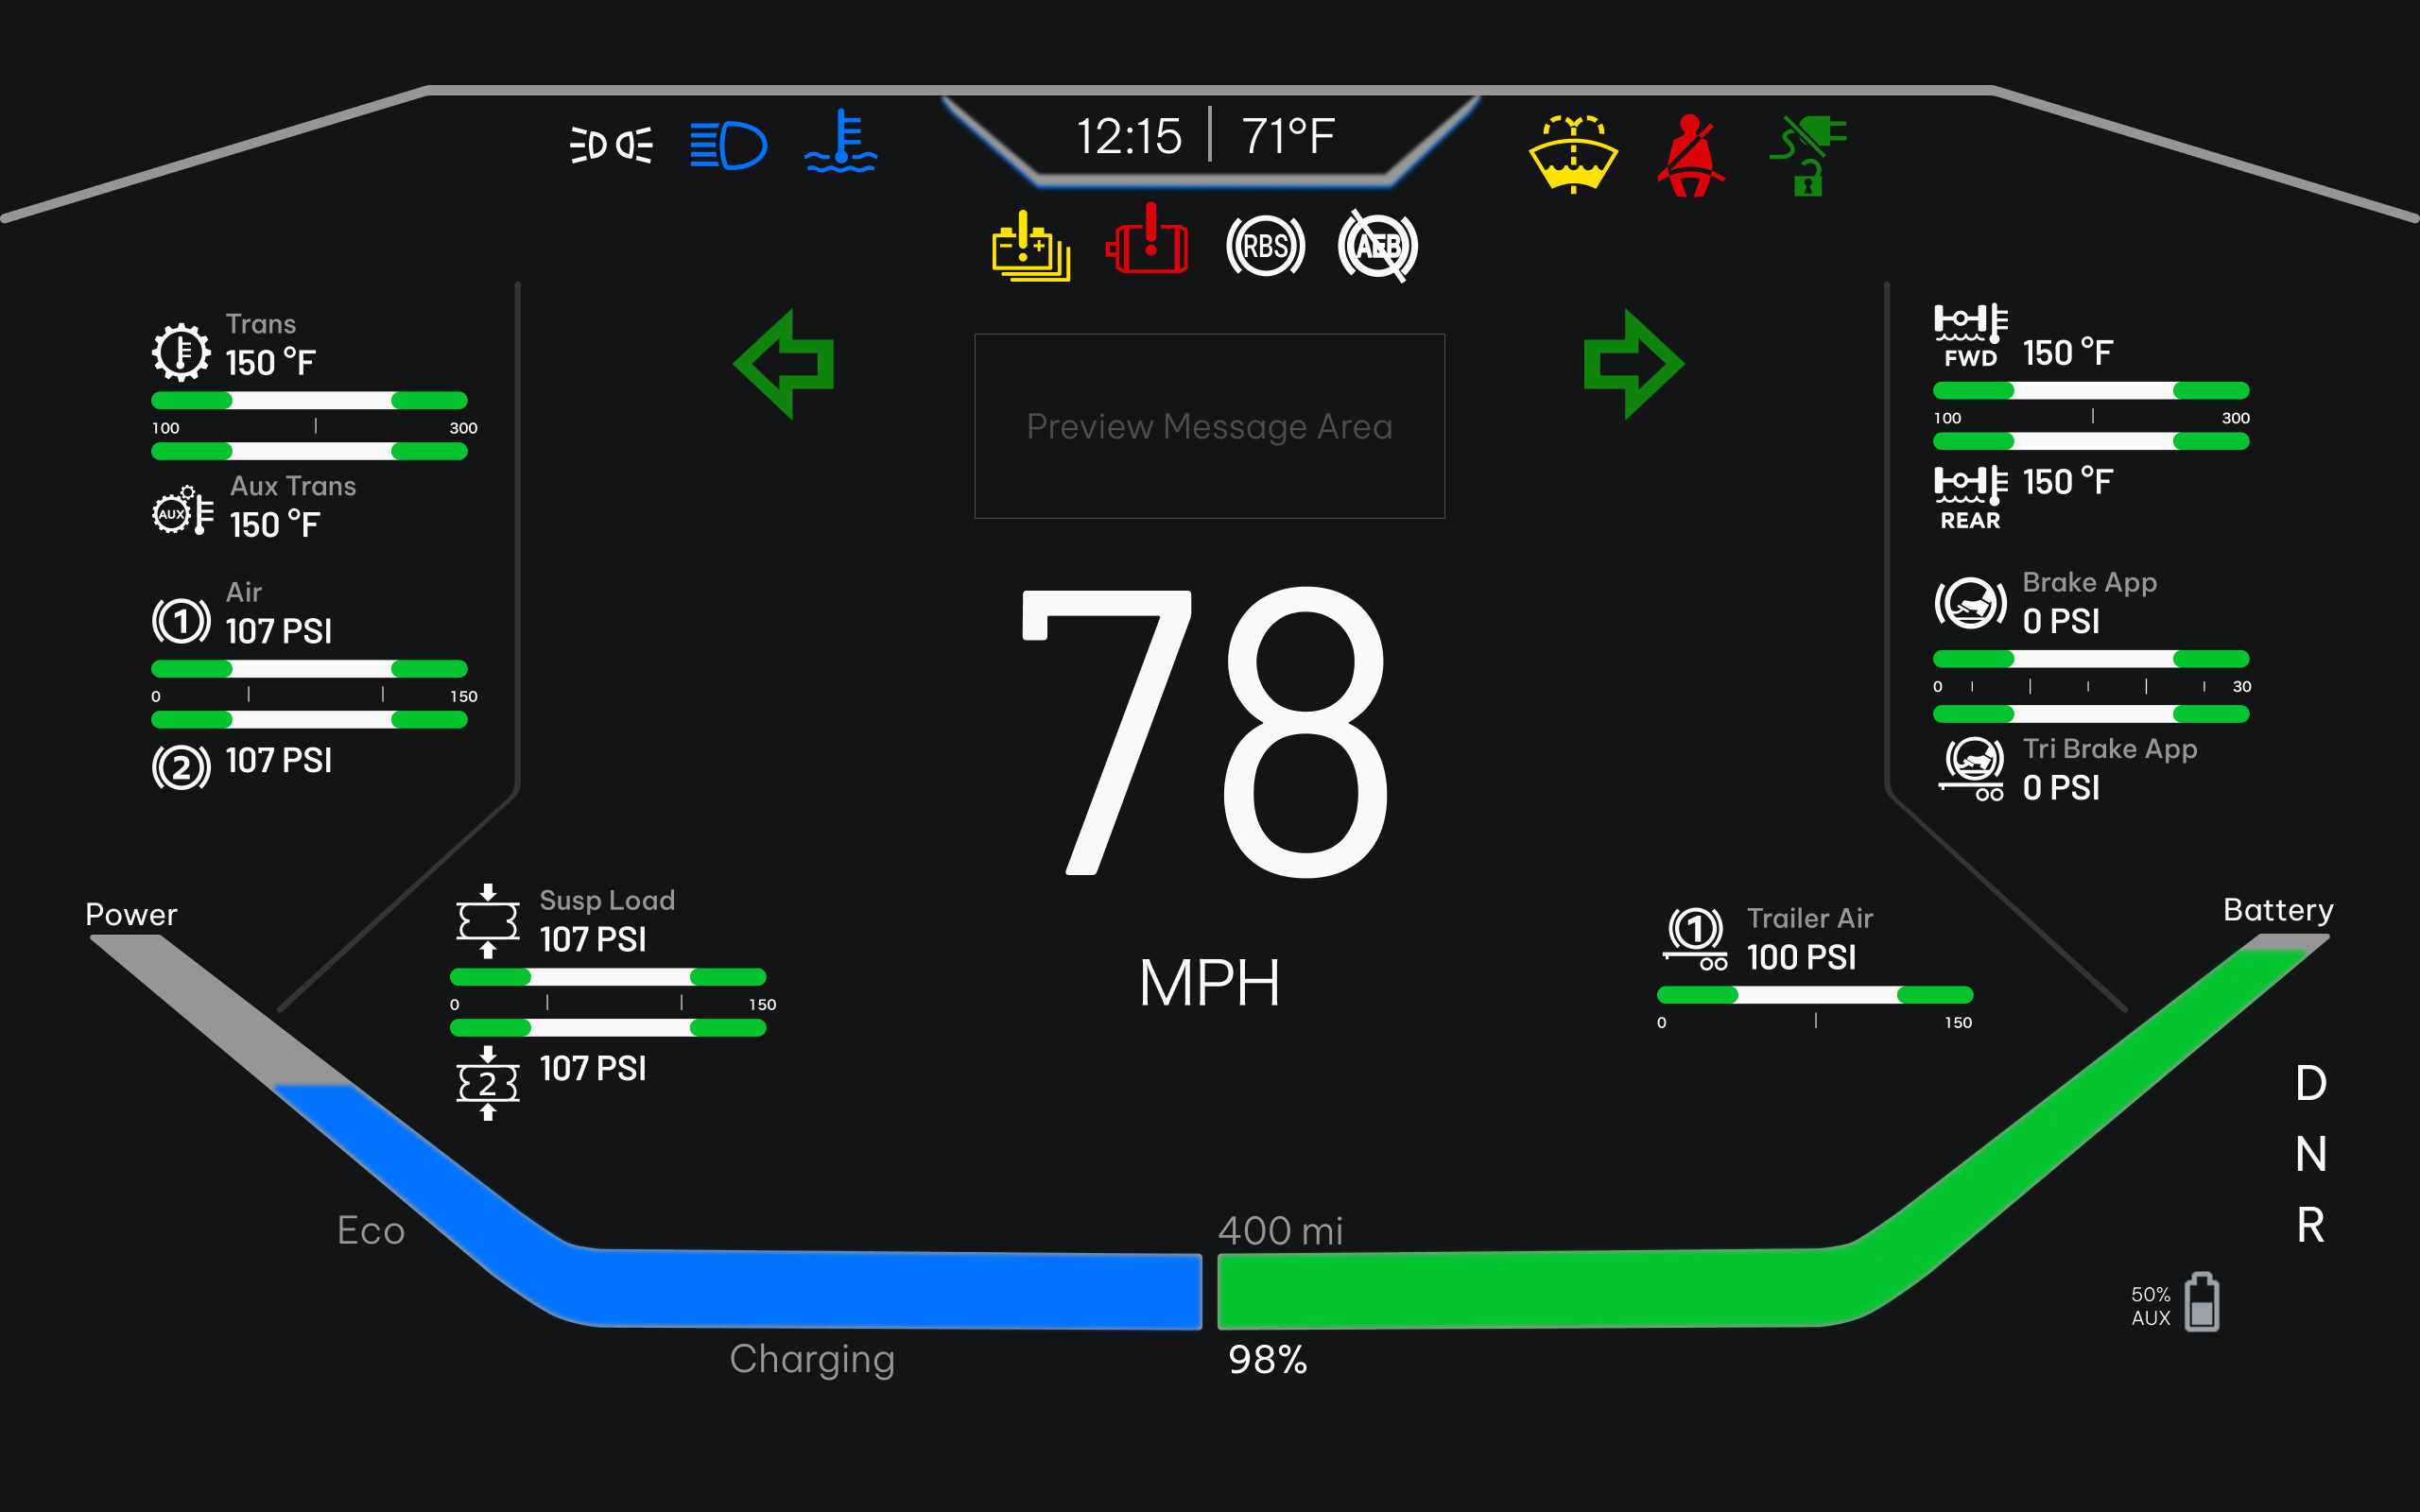
A-Cluster - Driver Instrument Display
Displayed in front of the driver behind the steering wheel. Houses all real-time feedback: speed, energy/range, warning icons, gauge metrics, and the regenerative charging bar.
 Hi-Fi · A-Cluster
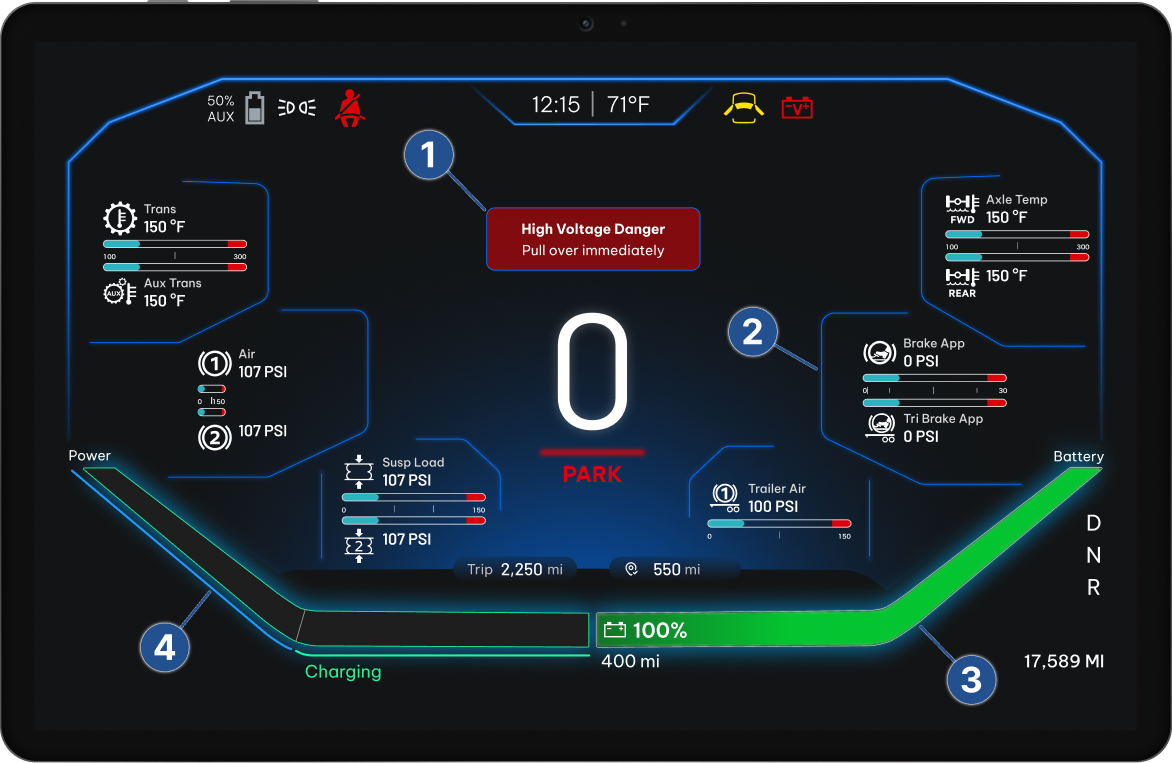
Personalized Messaging
Real-time risk messaging specific to the health status of the truck and driver's safety
Gauge Metrics
Kenworth-inspired gauges to communicate driving performance with diesel familiarity
Battery Status
Real-time battery bar to reduce range anxiety for long-haul driving
Regenerative Charging
Interactive bar showing power output & energy regeneration upon braking
A-Cluster - Live in the Cab
 ProtoPie Prototype
ProtoPie prototype simulating driving state - keyboard-controlled up and down arrows for the driving state
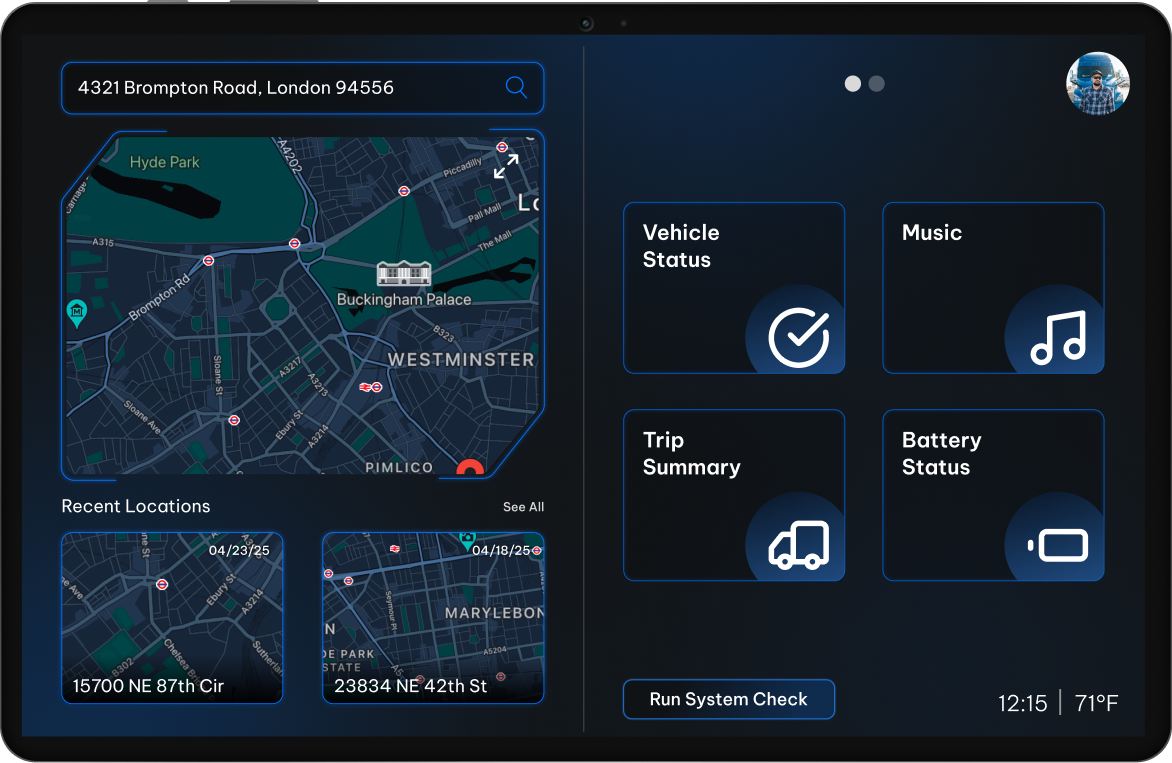
B-Cluster - Infotainment Display
Sits to the right of the driver. Houses navigation, media, vehicle status, trip summaries, and EV-specific metrics like powertrain performance and battery health.
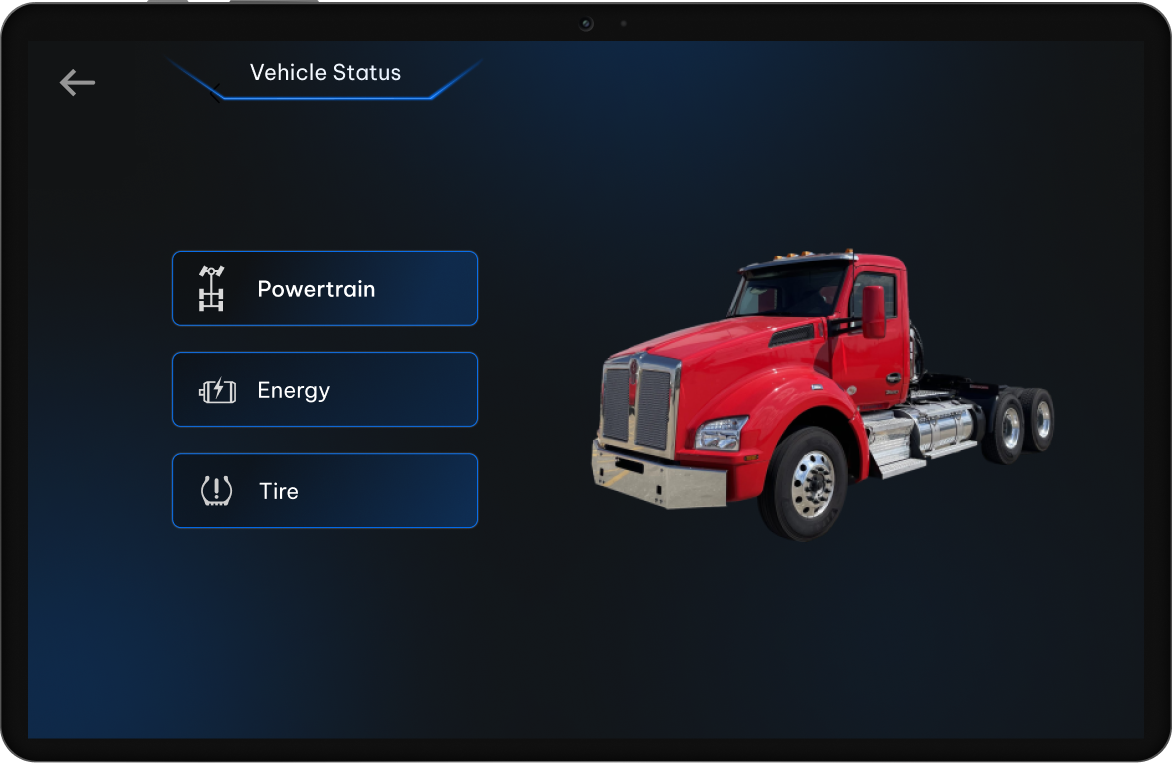
Vehicle Status
Vital information on truck performance: powertrain, energy output, and tire health
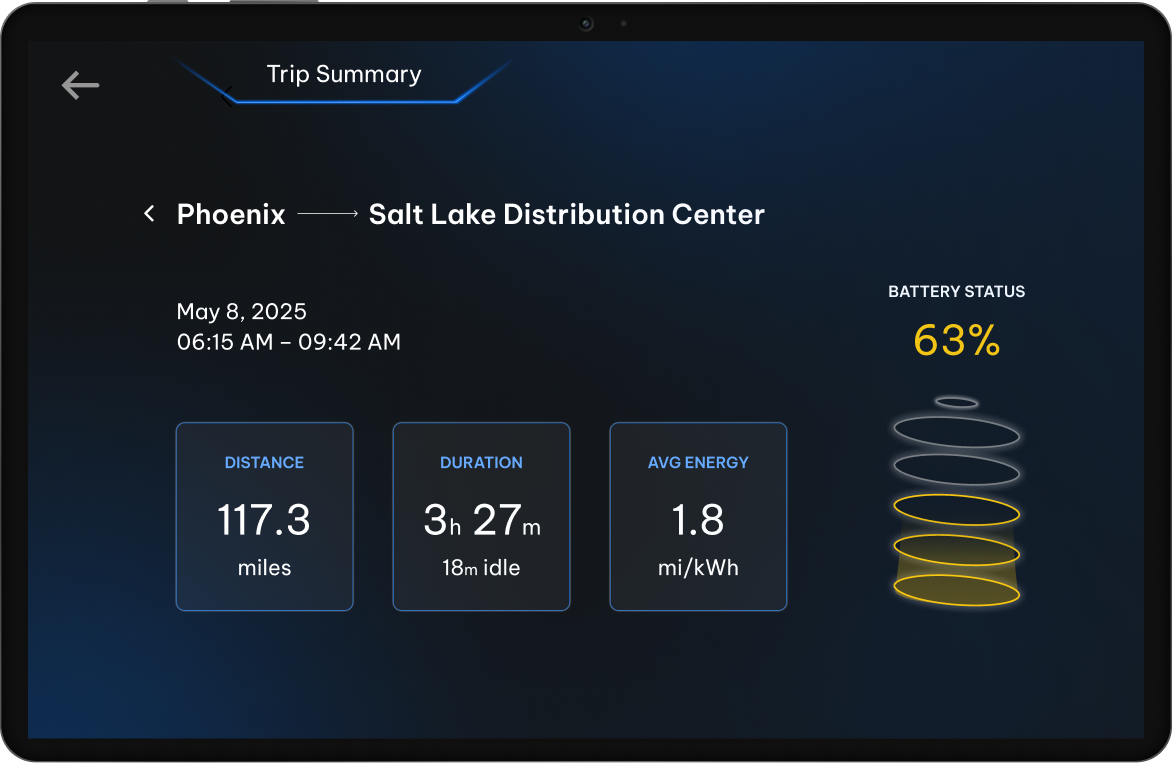
Trip Summary
Overview of distance, energy efficiency, drive time, and battery status per trip
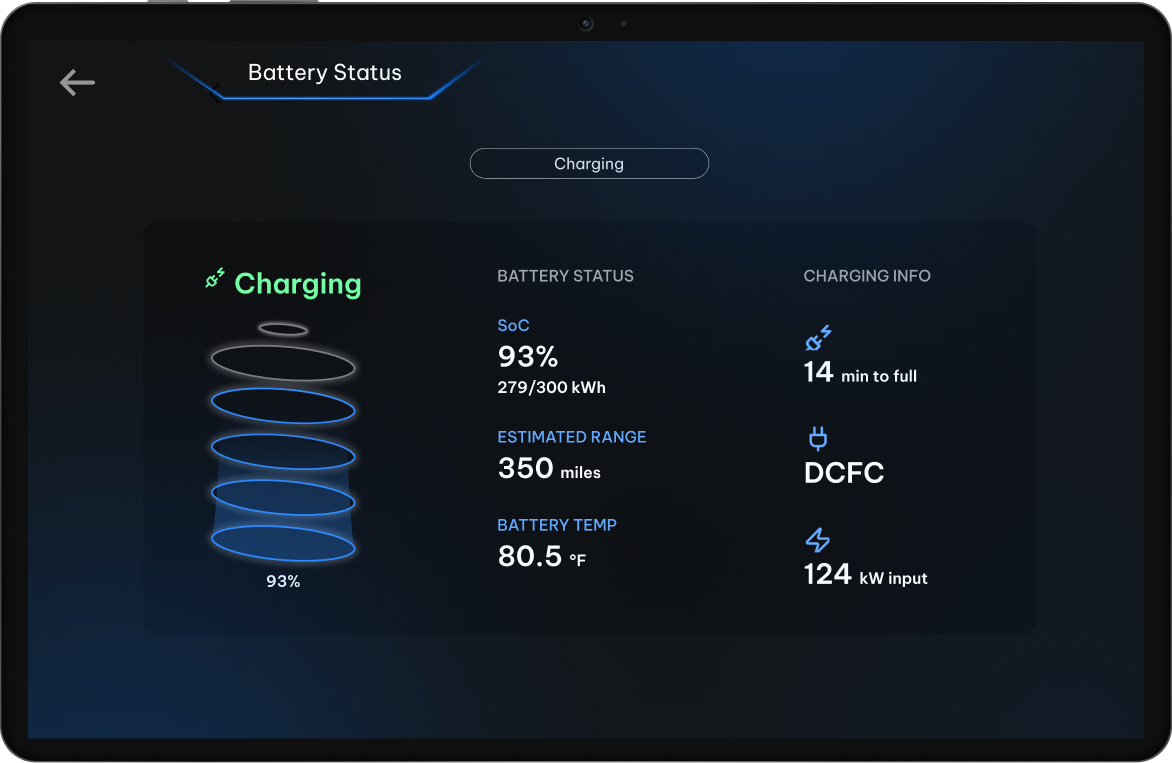
Battery Health
Communicates battery performance and charge cycles to reduce range anxiety
System Check
Initiates an A-Cluster check to comply with safety regulations and prevent breakdowns
A-Cluster System Check
 Figma · Animated
System check sequence A-Cluster: communicates the truck's pre-drive health checklist
07Reflection
Trucking makes the world go round!
I'm proud of this capstone project because it broke new ground for my major, marking the first-ever HCDE and PACCAR collaboration and earning the "Best Engagement/Impact" award out of 60 undegrad teams at the showcase.
Future members of E-Truck will take over our Figma designs, ProtoPie prototypes, and physical displays. The electrical and controls technical teams will handle wiring and programming the interfaces to communicate with the Electronic Control Unit (ECU) in the 2026 academic year.
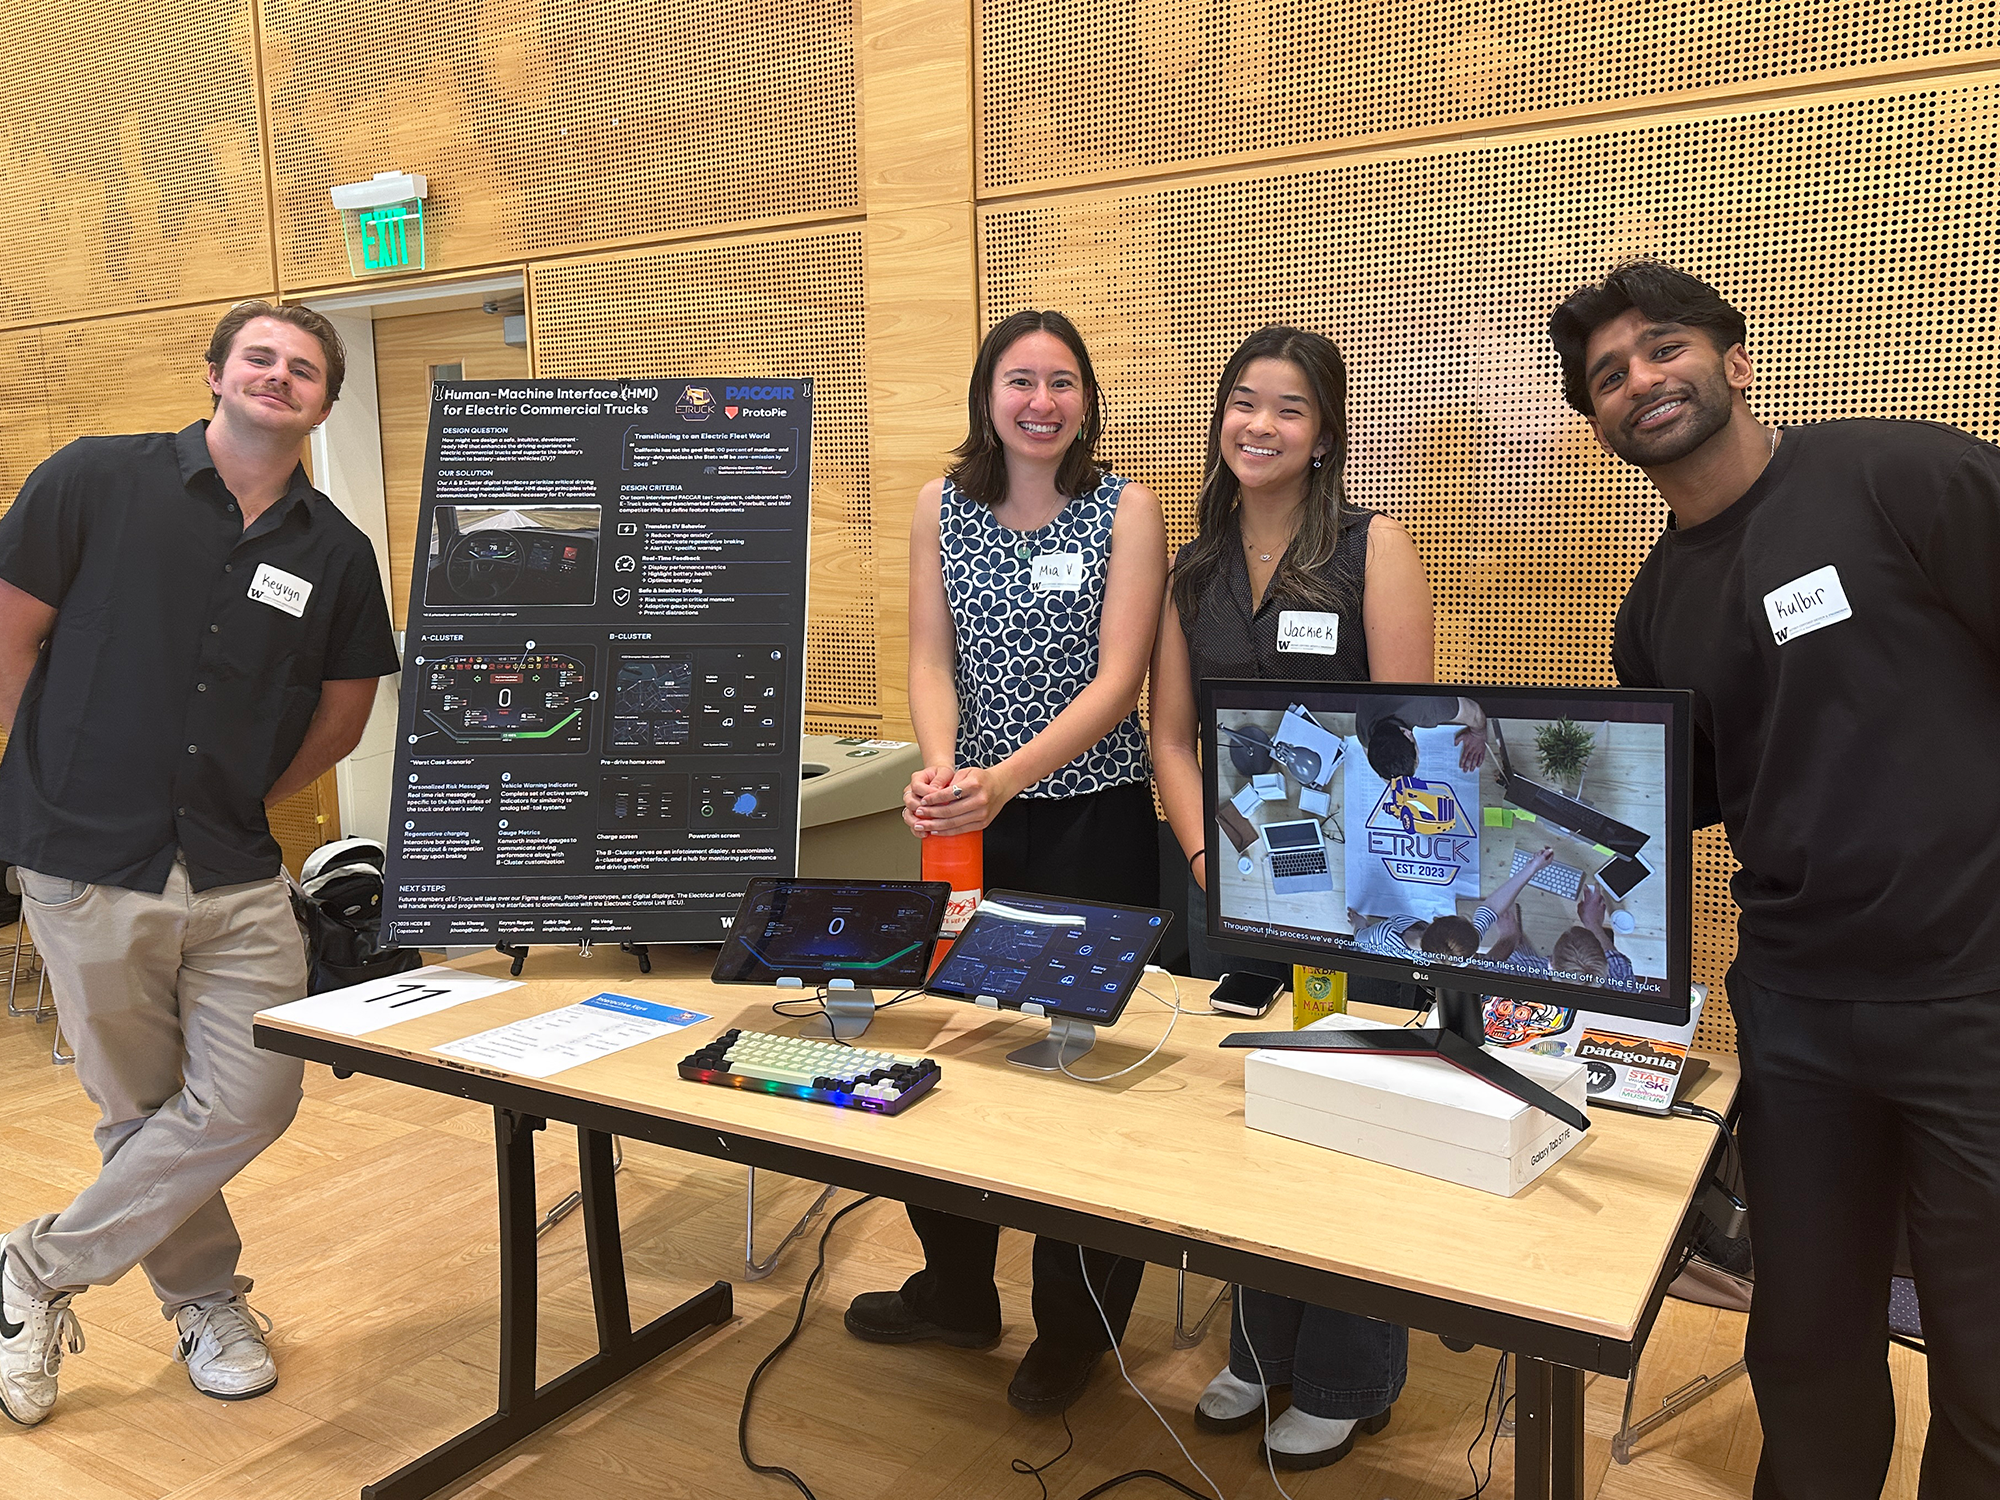
Capstone team picture - 2025 HCDE undergraduate showcase